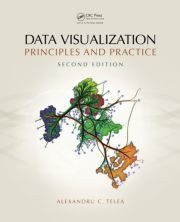
Data Visualization - Principles and Practice
Supplementary Material
(2nd edition, 2014, CRC Press; 617 pages, 448 illustrations)

Overview
This page contains additional online material for the book Data Visualization - Principles and Practice (2nd edition, 2014). This material can be used by readers, students, and teachers who intend to use the book in various practicing, educational, and training-related activities.
Structure of the material
The material is organized into several categories, as discussed below. For each category, material is further organized per book-chapter it relates to. All materials are accessible via the links in the left side-bar on this page.
1. Exercises
Exercises are questions or simple assignments that can be completed with pen and paper (or similar means), and do not require programming. They
- come in the form of both multiple-choice and open-ended questions
- can be answered succinctly (from a few lines of text to roughly one page)
- refer to specific sections in the book. The referred context is given in the body of the exercises by formulas, figures, or chapter/section references
Based on these exercises, examination subjects could be designed. Such subjects can be either open-book or closed-book.
Solutions for the exercises are available from the publisher to qualified instructors who adopt the book as teaching material for their course. For more details, please contact orders@crcpress.com.
2. Scenarios
Scenarios are pre-built visualizations, including an input dataset, a set of visualization algorithms organized in a pipeline, and parameter settings for these algorithms. They
- use as infrastructure the ParaView tool
- can be run easily, and with no programming, just by installing ParaView on your platform of choice (Windows, Mac OSX, or Linux), and next opening the respective scenario file
- allow exploring various data and/or visualization-algorithm aspects by changing the parameters exposed in the ParaView interface.
- reproduce many of the illustrations provided in the book
Note 1: These scenarios are not full-fledged visualization applications. Their more limited aim is to enable students to experiment with the parameters of a few specific visualization algorithms, using simple datasets, to better understand the working and limit cases of such algorithms.
Note 2: These scenarios require one to first download the various datasets provided separately.
3. Sample programs
Sample programs are relatively small applications that implement one or a few visualization algorithms and related data structures. They
- illustrate the various algorithmic and design choices made when implementing several visualization techniques
- come in the form of source code written in the C/C++ programming languages, using OpenGL and GLUT for graphics rendering and interaction respectively
- are self-contained. They do not use any third-party libraries apart from OpenGL and the standard C/C++ libraries (and CUDA libraries for a small subset of the samples)
- have a simple design to make them useful and usable for teaching purposes
- are ordered from very simple to more advanced ones, to help incremental learning
- are small (a few hundred of source code lines), to facilitate studying and learning
These programs are intended as teaching material. They are not a starting-point for designing real-world, highly-scalable, and computationally efficient visualization applications.
Note 1: The sample programs have been tested under Mac OS X and Linux. In order to keep their structure simple, we provide build files (makefiles) only for OS X. These files can be easily adapted to compile the programs on other platforms.
Note 2: Quite some amount of code replication exists between the different samples. This is on purpose, so that the code of each sample can be stored as a self-contained directory. While this is suboptimal from a code-reuse software-engineering perspective, it favors an easy installation, study, and experimentation with all samples.
Note 3: Most samples require just a standard OpenGL 1.1 compliant card. A small subset of the samples requires more advanced features, such as an NVIDIA CUDA capable graphics card (and the required libraries and drivers). For more information, see NVIDIA's online page on Getting started with CUDA.
4. Projects
Projects are descriptions of medium-size assignments that involve the construction of specific visualization programs, or applications. Each project
- focuses on a concrete small set of visualization algorithms
- is presented in the same format as exercises (a textual description of the prerequisites, deliverable, and way of working).
- can represent either a single separate assignment in a sequence of assignments for a lab session complementing a visualization course, or can be easily enhanced with additional requirements to create a full-term project for a visualization course.
- builds upon the sample programs provided above
- has minimal dependencies on (complex) third-party libraries or frameworks
To execute them, all projects require good programming knowledge in a mainstream programming language (e.g. C, C++, Java, C#, or Python), and a good understanding of the involved algorithms described in the respective book chapters.
5. Datasets
Various datasets are provided in the form of files. Each file contains a single dataset (with possibly multiple data attributes). Datasets are provided in various well-known and widely accepted formats, to make them easy to read by third-party applications. Separately, links are provided to several public repositories from where additional datasets can be downloaded for free.
6. Slides
We provide two sets of slides.
- scientific visualization: The first set covers spatial data representation and visualization, typically known as scientific visualizaton (Chapters 1-10)
- information visualization: The second set covers non-spatial data representation and visualization, or what is typically known as information visualization (Chapter 11).
These slides can be used as a basis for designing one or two full courses in data visualization.
Note: The slides have been designed for two separate semester-length courses on scientific visualization, respectively information visualization. Given the specific audiences and contexts of those courses, the provided slide sets are not a one-to-one reflection of the entire book. Several more advanced topics discussed in the book have been omitted in the slides. Conversely, topics only briefly touched upon in the book (or not even covered by the book) have been included in the slides. As such, the slide sets may require modification to customize them to the concrete aims, scope, and constraints of a specific visualization course.
7. Feedback
Feedback in the form of
- comments on the supplied online material
- additional material (datasets, code samples, tools, exercises, or projects) that users would like to include in this collection
are welcome and can improve the aims behind this material. A few notes on supplying feedback are provided below:
- scope: The main aim of the materials posted here is to support lecturers using the Data Visualization book in designing lab sessions, home exercises, or exams. As such, only materials that have a direct connection with specific book sections is of relevance.
- simplicity: Materials should be easily usable. In a nutshell, materials should be usable without having to read complicated documentation, install complex third-party packages, run complex build or configuration scripts, or use additional programming languages besides Unix command-line and C/C++. As a guideline, follow the material already included here.
- completeness: Materials should be self-contained, i.e. understandable and usable without having to read large amounts of third-party documentation or install third-party tools or libraries. The materials should be compilable by a modern C/C++ compiler.
- size: Materials should be of reasonable size (in terms of MB and number of files), to minimize hosting costs. While this is hard to quantify precisely, materials that are over roughly 50 MB in size are deemed too large.
- copyright: Materials should be in the public domain or equivalent. Ideally, we want to host them on this site, for the sake of persistence and self-containedness. As such, no constraints related to their distribution or copying should exist.
- accessibility: Only materials which are accessible freely, \emph{i.e.} without charges or copyright restrictions, are eligible.
Sending feedback: All feedback should be sent to the author (prof. dr. Alexandru Telea, a.c.telea@rug.nl)
