Chapter 2: From Graphics to Visualization
Scenarios
Chapter 2 introduces data visualization by first presenting the basics of computer graphics. As such, the samples for this chapter are illustrations of basic computer graphics techniques treated in this chapter. For more involved visualization samples, please consult the scenarios for the upcoming chapters. Also, consult the code samples for Chapter 2.
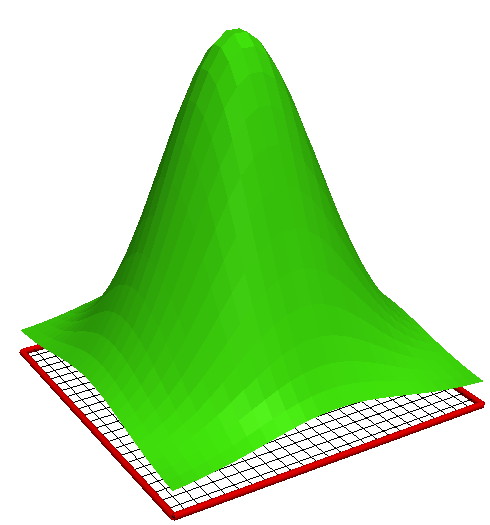
Function plot (flat shading)
This scenario demonstrates the creation of a plot of a 2D Gaussian function, using flat shading. This is equivalent to nearest-neighbor interpolation of the shading function, as discussed in Chapter 3.

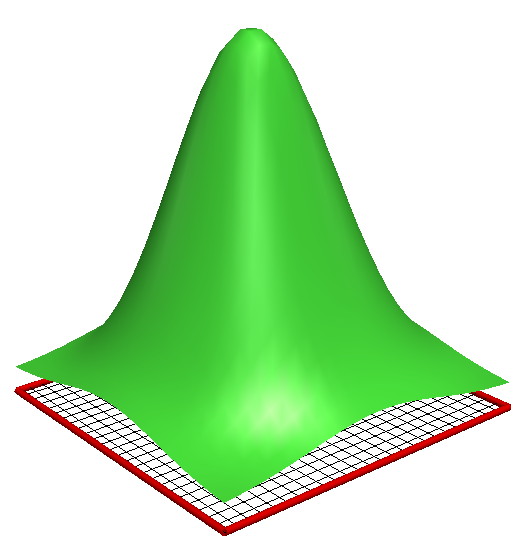
Function plot (smooth shading)
This scenario demonstrates the creation of a plot of a 2D Gaussian function, using smooth (Gouraud) shading. This is equivalent to bilinear interpolation of the shading function, as discussed in Chapter 3.

