Chapter 11: Information Visualization
Sample programs
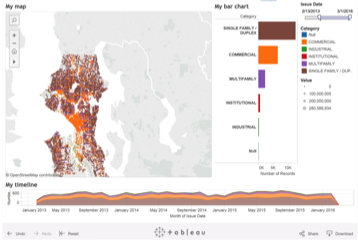
Tableau: Infovis charts
Tableau is probably the best-known general-purpose tool for creating interactive information visualizations. It offers a programming-free way to construct many types of charts by visually dragging and dropping data dimensions from an input dataset to many types of visualizations (charts, treemaps, scatterplots, bubble plots, maps, and more). The created visualizations can be exported to web pages and shared in a few clicks! The lightweight version of the tool, Tableau Public, is free for any type of use, and can import data from Excel and CSV files.
Tableau Public (Windows, Mac) (external link)
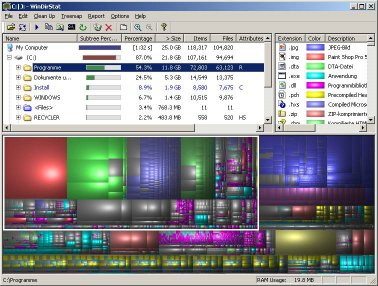
Treemaps: Disk visualization
This set of tools (WinDirStat, KDirStat, Disk Inventory X) provide visual exploration of the tree-structure formed by a directory-and-file system. The tools demonstrate nicely the added-value of cushion treemaps. Use these tools to explore your hard disk (or similar file systems), and understand the distribution of your files in terms of size, type, or other attributes. Explore the tools' source code to understand how cushion treemaps are implemented. Modify the code to visualize other tree structures!
WinDirStat executable and source (Windows) (external link)
KDirStat executable and source (Linux) (external link)
Disk Inventory X executable and source (Mac OS X) (external link)
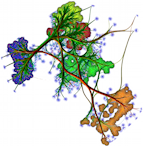
Projection Explorer
ProjectionExplorer (PEx) is a Java-based open-source framework for the interactive visual exploration of large multidimensional infovis datasets. Such typical datasets come as tables where each table row represents an observation of some phenomenon, and each table column represents a measured dimension. Hence, rows are similar to sample points, and columns are similar to data attributes. However, in contrast to scientific visualization (scivis) tools, the PEx tool provides
- support for a very large number of dimensions (thousands)
- support for representing numerical, categorical, text, and image attribute types
- many algorithms for multidimensional data, e.g. scatterplots, histograms, dimensionality-reduction projections, and graph layouts
- specific techniques for analyzing text and image collections
Besides this, PEx provides classical tools such as multiple views, interactive brushing and selection, and color mapping.
PEx download page (external link)
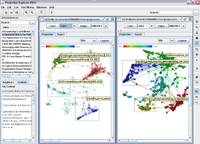
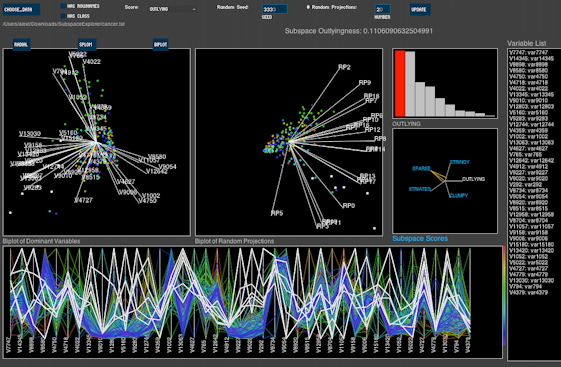
Subspace Explorer
Subspace Explorer is a Java tool for the interactive visual exploration of multidimensional infovis datasets. It offers a set of linked views featuring different visual exploration techniques: parallel coordinates, scatterplot matrices, multidimensional projections, and biplot axes. While not as sophisticated and customizable as ProjectionExplorer, Subspace Explorer is considerably easier to use and requires no programming at all. Input datasets can be easily supplied in plain text file (see tool's documentation). This is a great place to start learning about multidimensional data visualization. Details about how to use the tool are provided in the accompanying publication below.
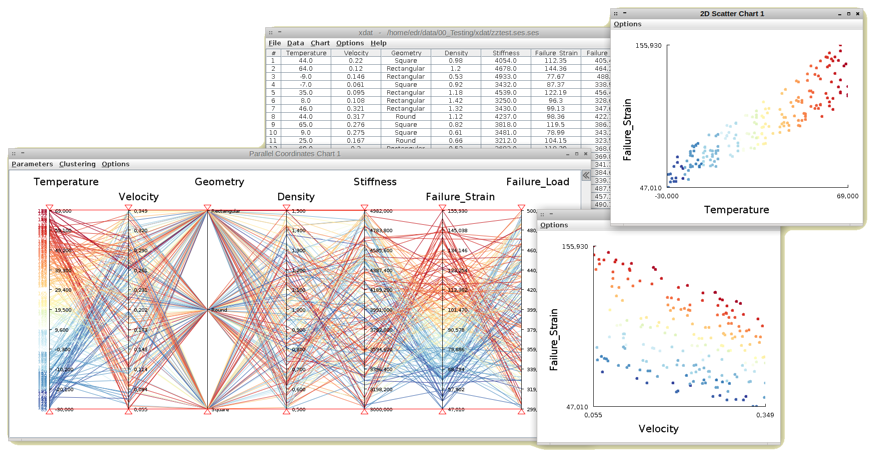
Xdat
Xdat is a Java tool for the interactive exploration of multidimensional datasets using parallel coordinates and scatterplots. It offers the standard features of the these two plot types, such as axes reordering, observation selection, brushing, and multiple linked views. Input datasets can be supplied in a simple text-based tabular format. The tool is as easy to use as Subspace Explorer (though, it offers slightly less features). It is a very good place to start learning how parallel coordinates work in conjunction with scatterplots.
Xdat download page (external link)
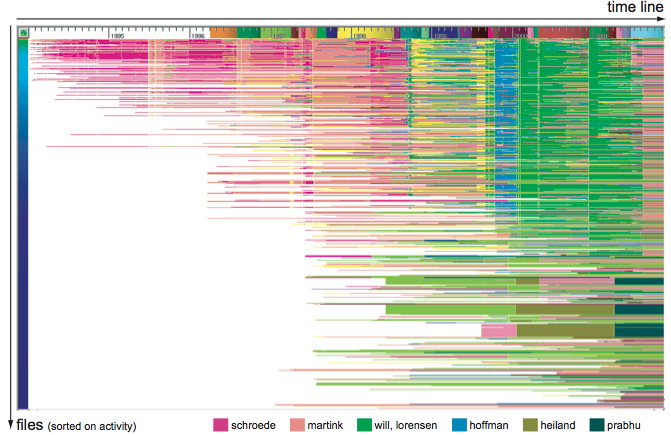
Software repository visual analysis
This tool (Solid Trend Analyzer, or SolidTA) provides visual exploration of large Subversion (SVN) and Team File Server (TFS) software repositories. The tool is simple to use: point it to a repository address, perform several data acquisition steps, and next visually explore correlations and trends involving several attributes such as files, commit moments, commit logs, and software quality metrics. The visualizations demonstrate several infovis aspects such as space-filling techniques, large data handling, multivariate exploration, and focus-and-context interaction.
SolidTA for SVN and TFS repositories (redirect link)
Example term assignment using SolidTA (redirect link)