Chapter 3: Data Representation
Sample programs
Basic Dataset Implementation
This set of samples demonstrates the step-by-step implementation of uniform, rectilinear, structured, and unstructured grids. Fully compilable C++ code is provided that implements 2D versions of these grids, using quad cells. Separately, we provide the implementation of 3D unstructured grids with triangle cells, used to manipulate surface meshes. Additionally, the implementation of scalar and vector vertex-attributes is provided. The code also includes a simple rendering module that allows visualizing these grids, based on the graphics-rendering samples in Chapter 2. This code can serve as a starting base to implement more complex grids (e.g. 3D grids). Separately, this code is used by the visualization-algorithm samples in Chapter 5.
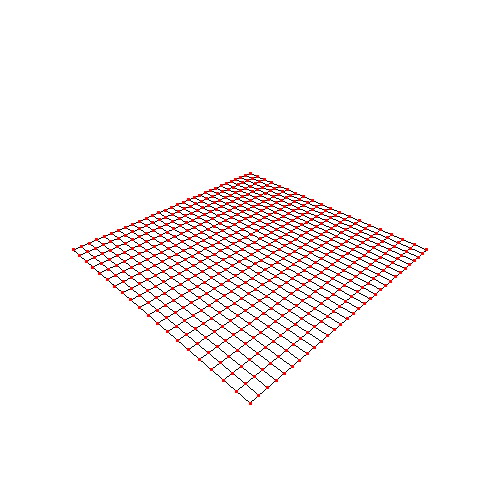
Uniform grids
This sample demonstrates the construction of 2D uniform grids.
Rectilinear grids
This sample demonstrates the construction of 2D rectilinear grids.
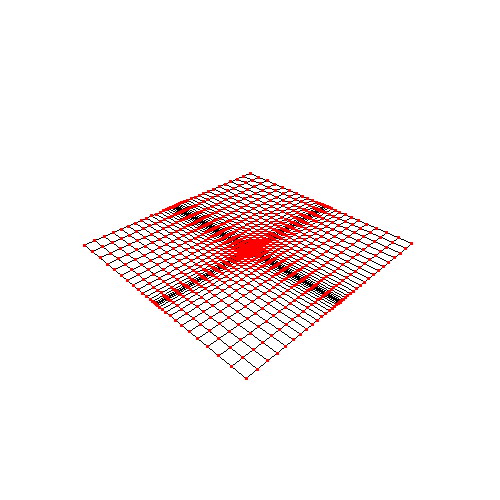
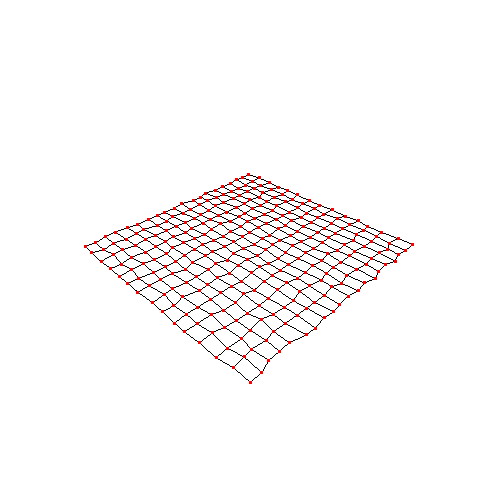
Structured grids
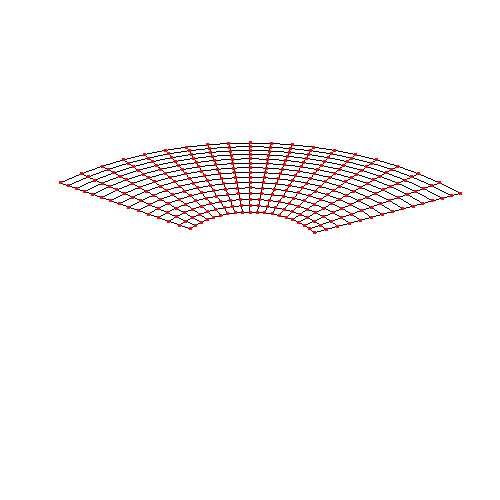
This sample demonstrates the construction of 2D structured grids. Examples are given for a structured grid obtained by jittering the vertices of an uniform grid, and a structured grid using polar coordinates.
Unstructured grids
This sample demonstrates the construction of 2D unstructured grids. The grid vertices and cells are provided as a simple text file. Change this text file to create and visualize your own grids!
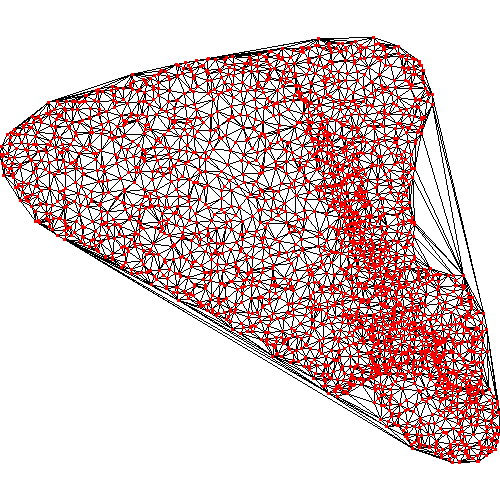
3D unstructured grids (meshes)
This sample demonstrates the construction of 3D unstructured grids with triangle cells. Such grids are typically used to store surface meshes. The sample also provides code to read 3D meshes from files in the Stanford PLY mesh format, computing cell and vertex normals (used for flat and smooth shading), and a simple tool to interactively manipulate the OpenGL camera in 3D using the mouse (based on the ZPR library). Try this with your own PLY surface meshes!
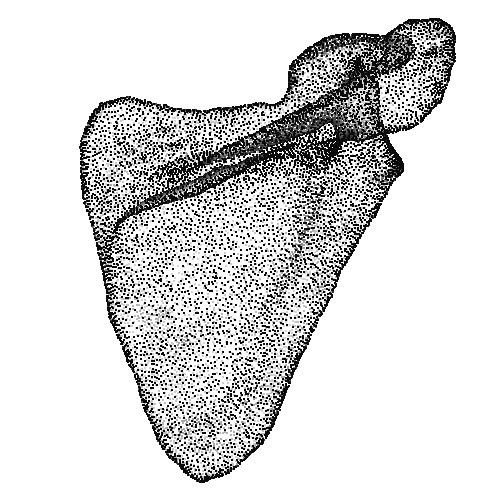
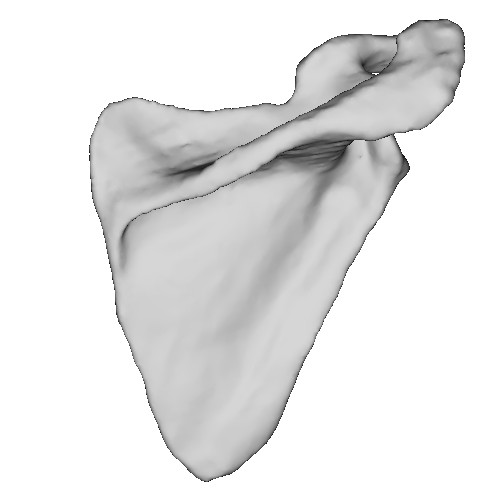
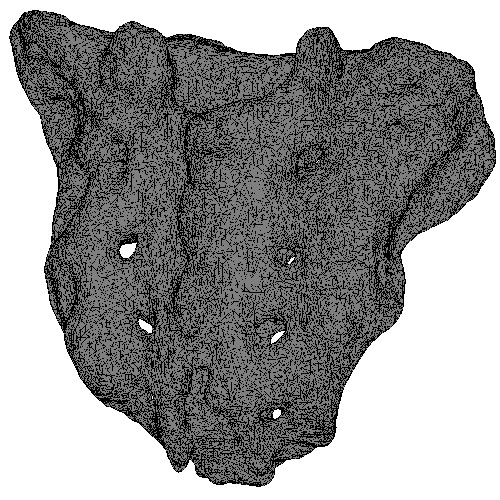
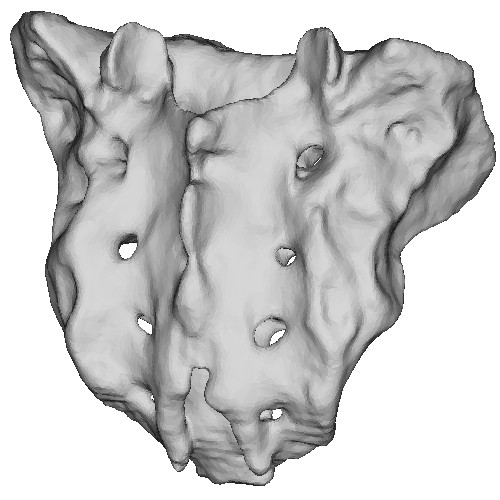
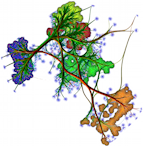
Image-based Voronoi diagrams
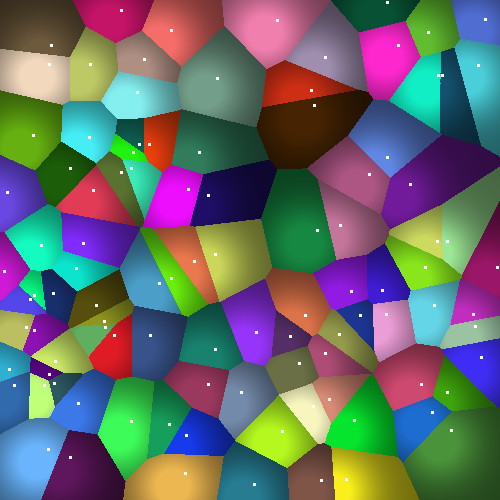
Given a 2D point cloud, this sample computes a pixel-accurate Voronoi diagram. The diagram cells are additionally drawn using shaded cushions, a technique further used and explained in Chapter 11. In comparison to computational geometry techniques, this implementation uses an image-based approach with OpenGL fragment shaders, which is very simple and fast.
Voronoi diagrams and Delaunay triangulations (online)
This online applet demonstrates the computation of Voronoi diagrams and Delaunay triangulations for a 2D point cloud. Good to interactively test how such structures look for a (simple) user-provided point cloud
Voronoi/Delaunay applet (external link)
Delaunay triangulations (C++ code)
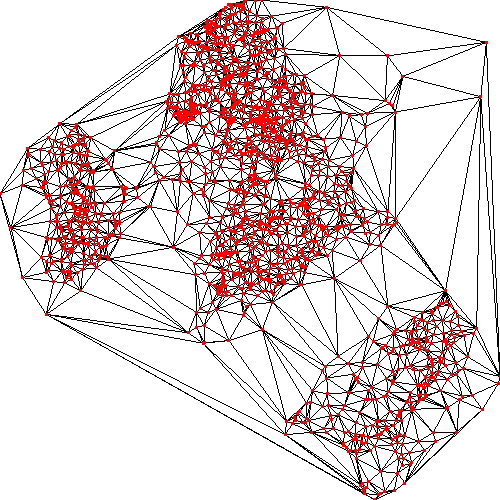
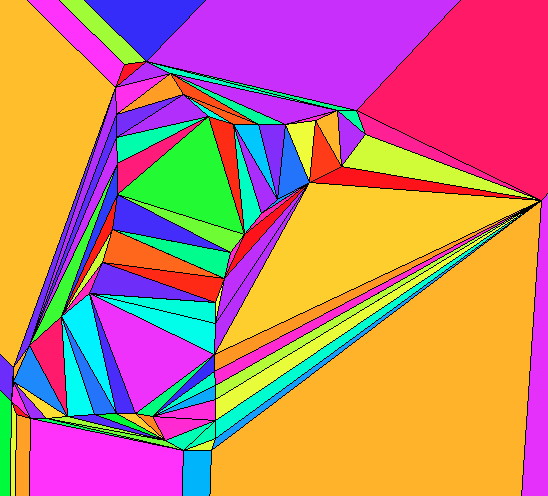
This sample demonstrates how to triangulate a 2D point cloud to create an unstructured grid. For illustration, we create a 2D point cloud by reading a PLY mesh file, and projecting its 3D vertices to a user-selected plane. We next use the Triangle library to triangulate this 2D point cloud. Try the sample by using other PLY files, or creating your own 2D point cloud to triangulate! Also, you can explore the many other triangulation options offered by the Triangle library.
Nearest-neighbors for point clouds
See the sample Color mapping, picking, and searching on 3D meshes provided for Chapter 5.