Chapter 5: Scalar Visualization
Sample programs
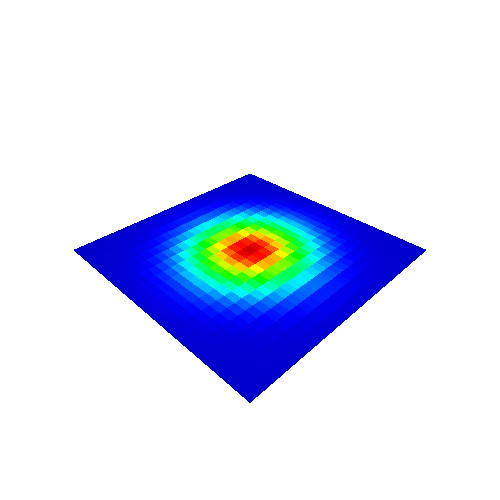
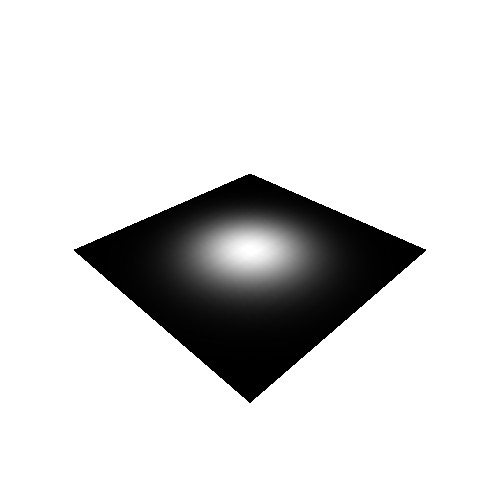
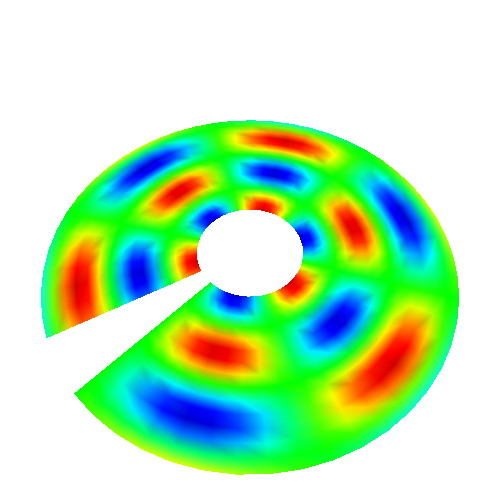
Color mapping on 2D grids
This set of samples shows how to implement simple color mapping on 2D grids. Scalar values are defined by sampling a 2D function, and stored on the grid using the scalar-attributes implementation introduced in the samples of Chapter 3. As illustration, we use a rainbow colormap, a grayscale colormap, and a saturation colormap. The samples also demonstrate nearest-neighbor vs bilinear interpolation of scalars. The samples can be extended e.g. by constructing different colormaps, visualizing different scalar functions or other datasets, or implementing color-mapping on other grid types.
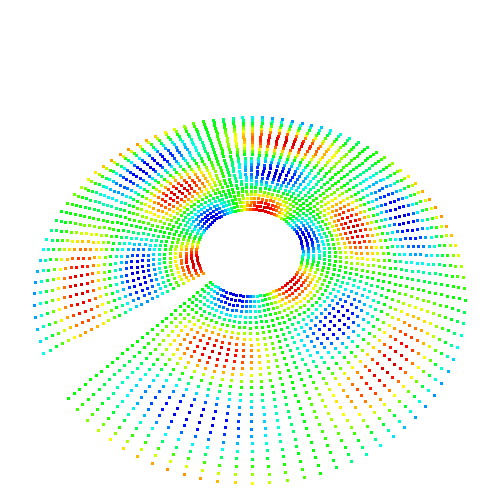
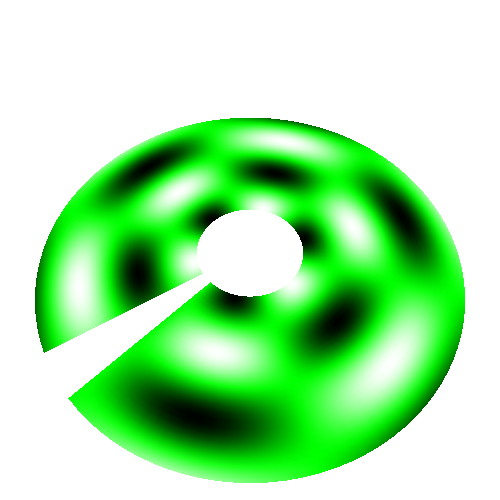
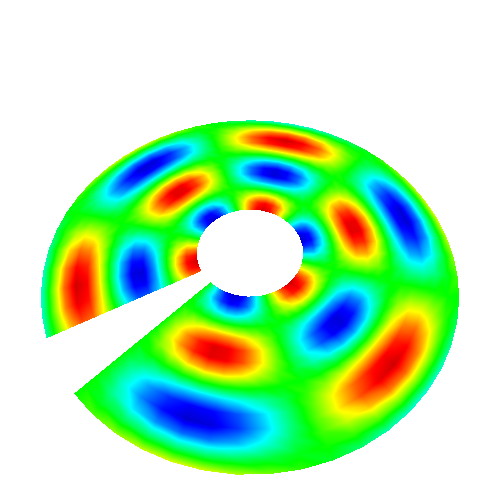
Advanced color mapping on 2D grids
This set of samples refines the simple color-mapping presented in the samples above, by adding texture-based color mapping. Scalars are mapped to 1D texture coordinates, and colors are created by mapping a predefined texture that stores the colormap. Cycle through the different colormaps and color-mapping modes to see the quality increase! Next, create other higher-frequency scalar signals and/or use lower grid resolutions to better see the advantages of texture-based color mapping.
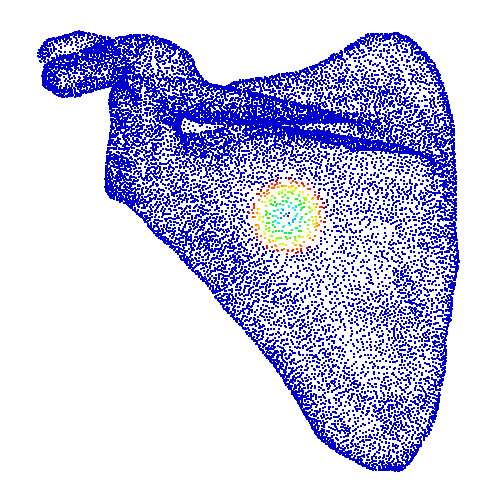
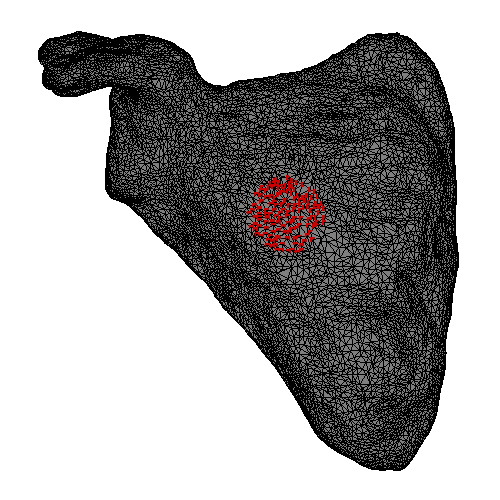
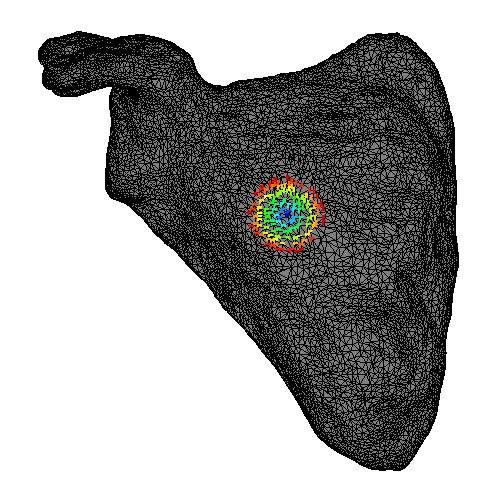
Color mapping, picking, and searching on 3D meshes
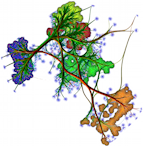
This sample demonstrates how to interactively pick a 3D vertex from a 3D surface mesh, by extending the 3D Unstructured Grid sample from Chapter 3. Additionally, it shows how to search the K closest points in a point-cloud to a given (pick) point, using the Approximate Nearest Neighbors library. Selected points and their distances to the pick point are visualized using scalar color mapping on 3D meshes. As such, this sample is relevant to Chapter 2 (interactive 3D picking), Chapter 3 (unstructured point datasets), and Chapter 5 (color mapping on 3D meshes).
Color mapping, picking, and searching on 3D meshes
Height plots
-simple sample showing how to warp a 2D grid with the value of a function. For this create a new renderer that does this plot.
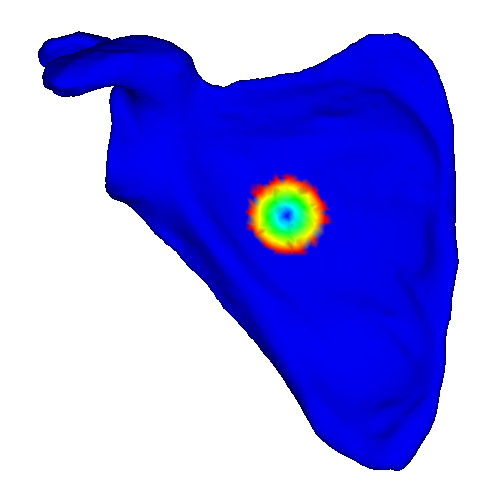
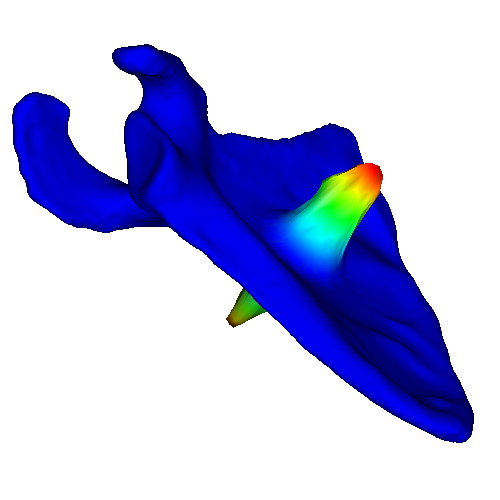
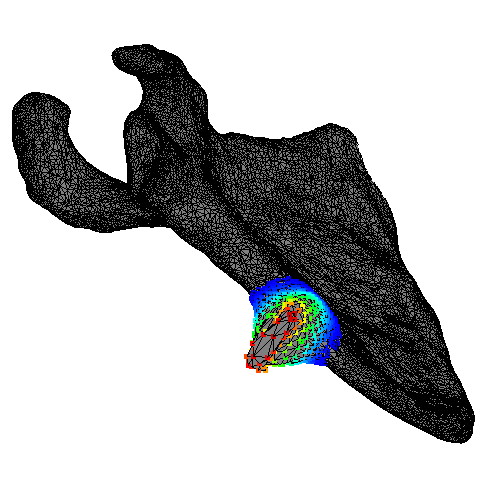
Warped surfaces
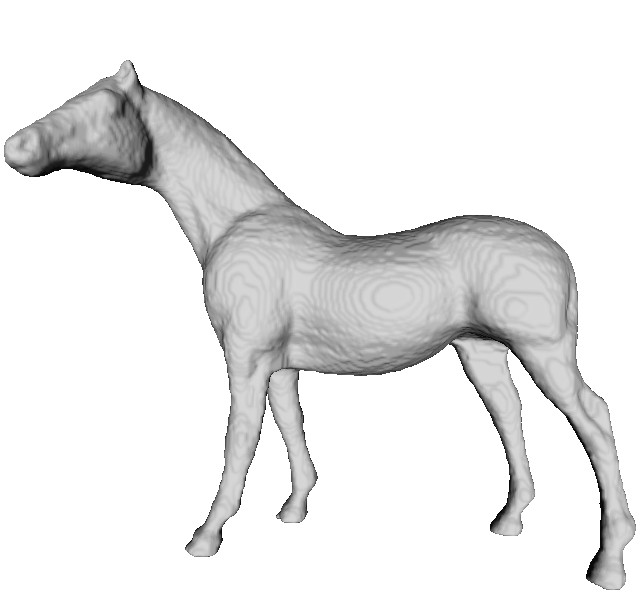
This sample demonstrates how to create a warped plot by shifting the vertices of a general 3D surface in the direction of their vertex normals, based on the value of a scalar signal. Interactively pick any vertex on the surface: The sample next computes a scalar signal which encodes a Gaussian function whose maximum is at the pick point. This signal is next used to warp the 3D surface. The sample is based on the color mapping, picking, and searching sample listed above. Try this using other PLY surfaces, and other scalar functions defined on the surface!
Isosurfaces
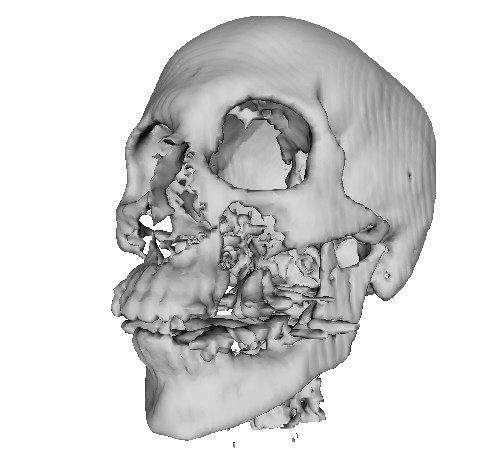
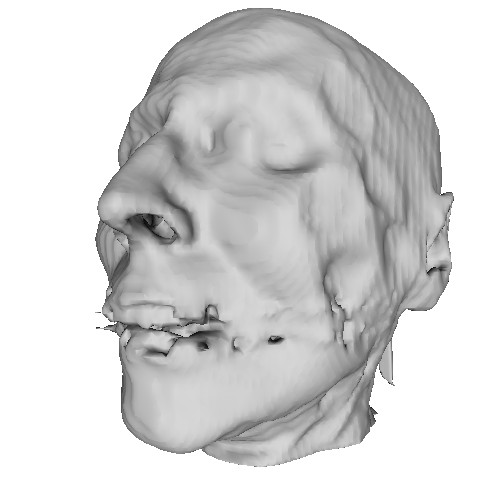
This sample demonstrates how to create an isosurface from a 3D scalar dataset. The sample implements a (simple) version of the matching cubes algorithm. The input dataset, a 3D uniform grid with scalar values, is implemented using the Volume class described in more detail in the samples for Chapter 10. The isosurface is stored as a 3D unstructured triangle mesh, and rendered using the techniques described in the samples for Chapter 3.
Try changing the isosurface level interactively to reveal other hidden structures. Alternatively, try to isosurface other 3D scalar datasets.