Scientific Visualization
headed by Dr. Steffen Frey and Dr. mat. nat. Christian Kehl
Scientific visualization explores techniques, methodologies and design procedures to visually represent, filter and navigate complex scientific data from various domains. The visual outcomes are use to gain insights in data, study complex- and interrelated processes, comprehend data relationships, communicate synthesized knowledge, or tell comprehensive stories about the data-driven research process.
Our research in this domain is multi-faceted, involving technical, methodological and design aspects to address visualization challenges in handling large data, representing and exploring complex, multi-dimensional data, and improving the interactivity and clarity in navigating coupled, multi-source data streams. Our technical focus is on time-dependent 2D-/3D filtering, representation and rendering, for which we investigate original approaches and extensions to direct volume rendering, machine learning, and stochastic process modeling. We furthermore leverage the augmented potential of modern platforms, such as smart- and mobile devices as well as eXtended Reality platforms. Methodologically, we develop new data representations and filtering mechanisms, and exploit machine learning to assist the representation development. Lastly, we explore new design approaches- and patterns to clarify data investigation and interaction. Our design procedures further aim to improve storytelling of scientific data along the needs in science communication.
The research results are employed within domain-specific partnerships for the medical sciences, astronomy, the geo- and environmental sciences. Our partners are everywhere: on a regional, national, European and international level – and we are always on the look for more partnerships, where possible.
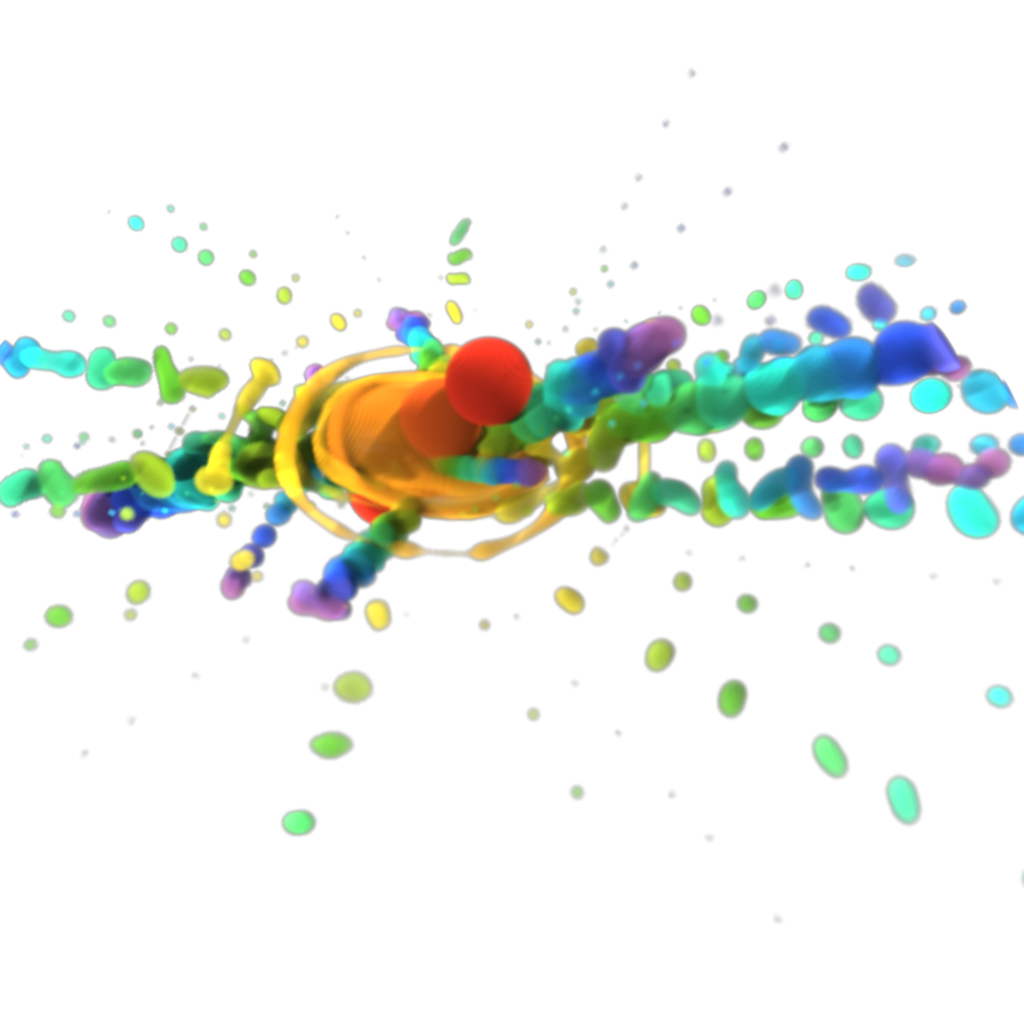
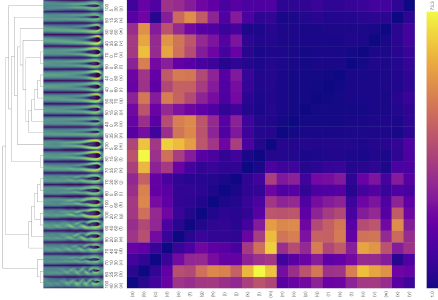
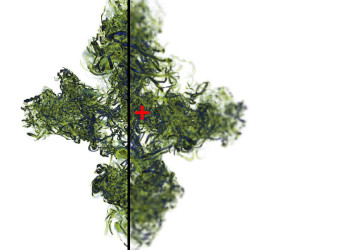
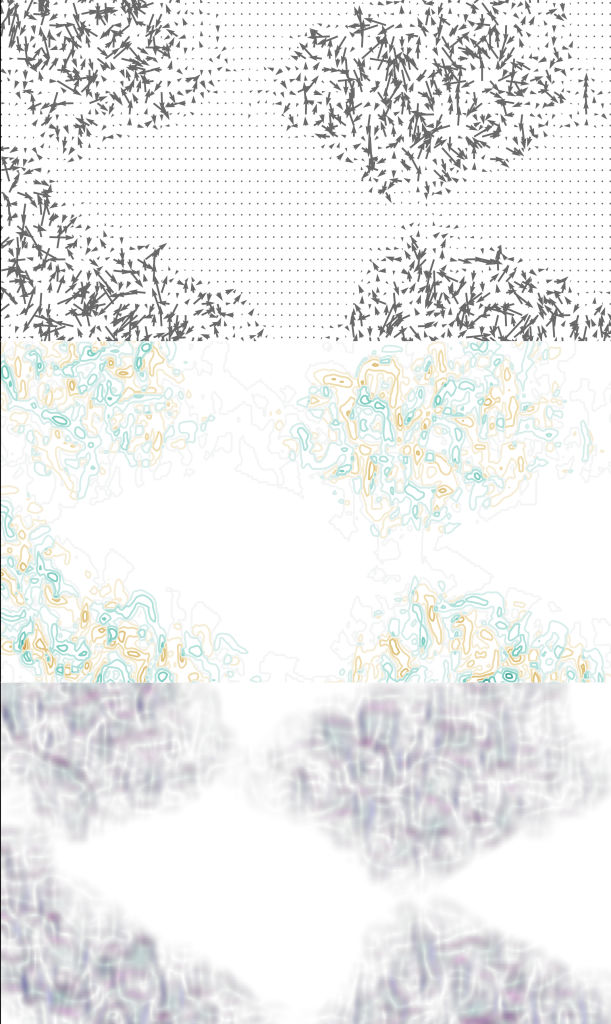
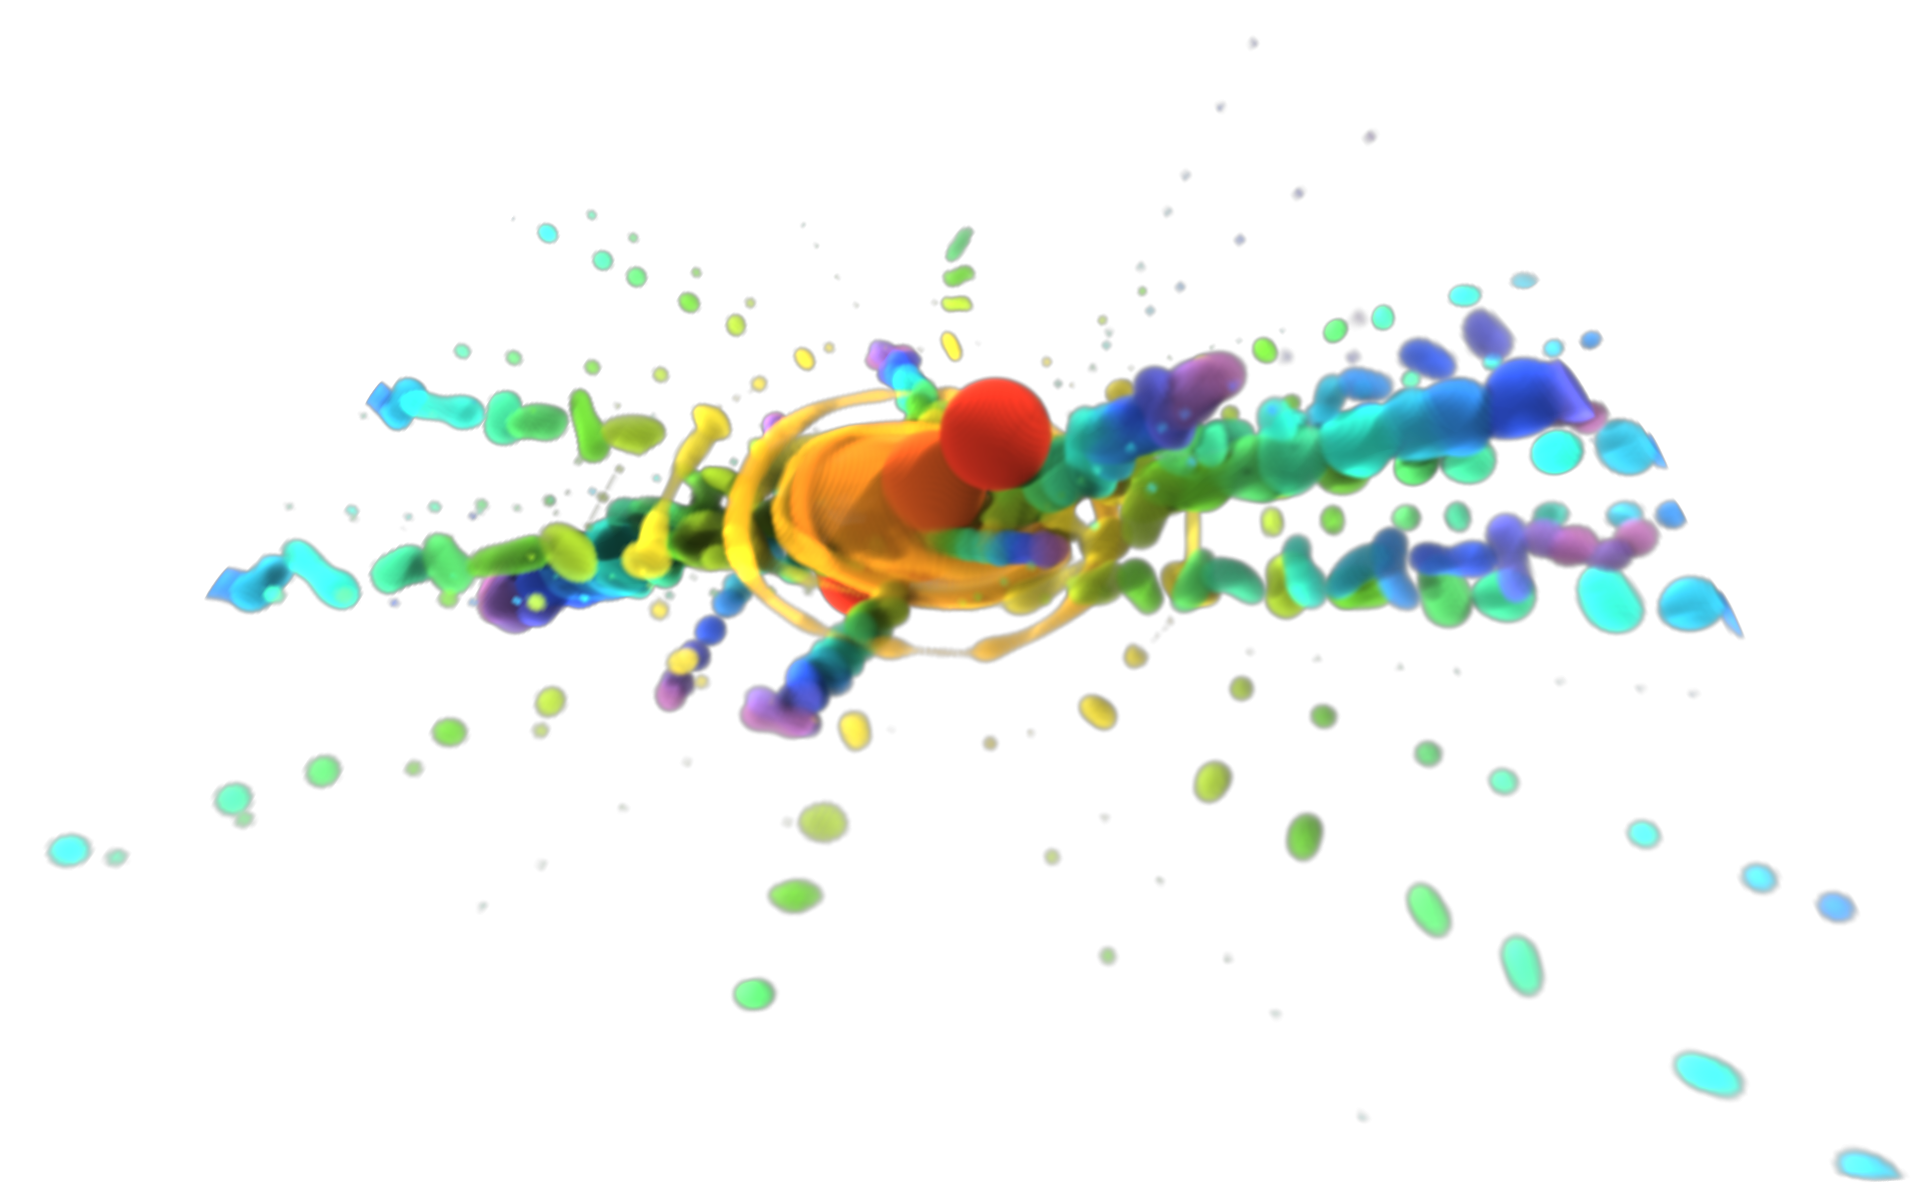 Volume visualization of a droplet simulation. | 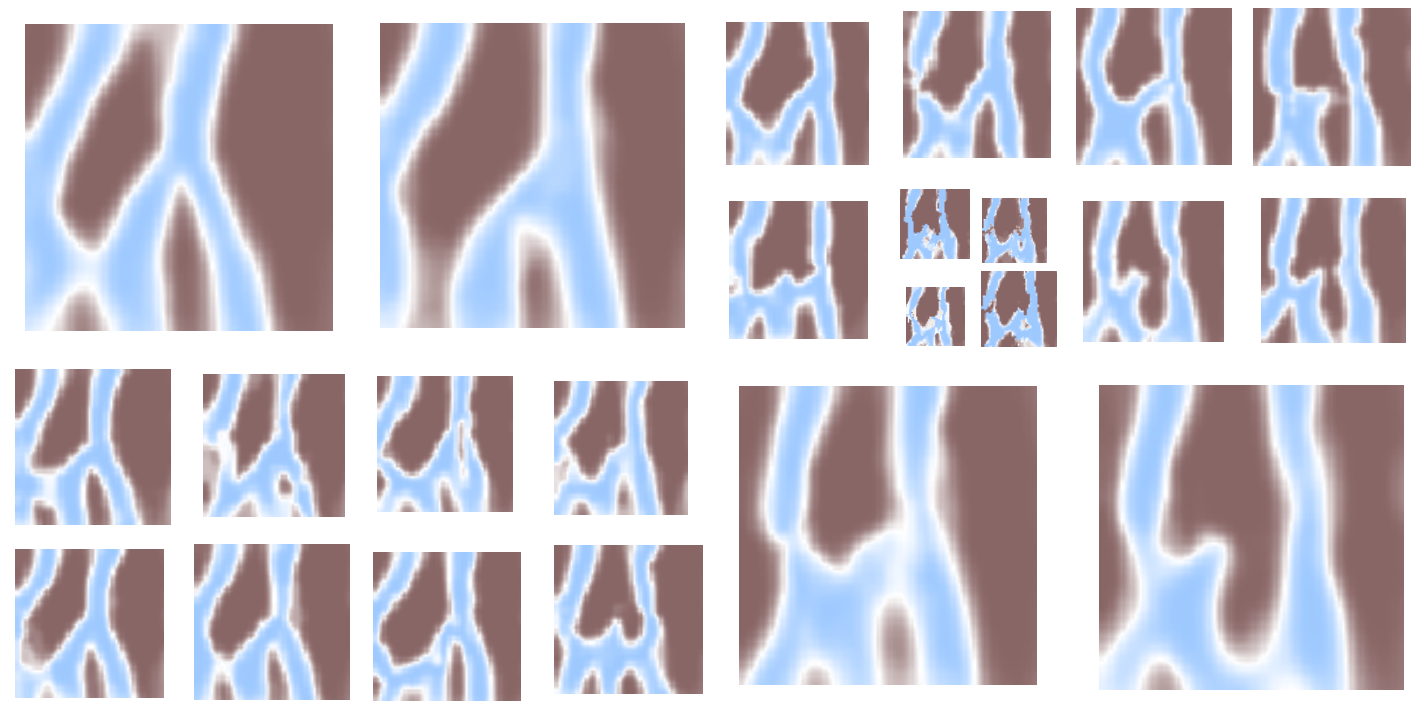 Level-of-Detal grid (LDG) of a channel structure ensemble generated by Monte Carlo-Markov Chains (MCMC). | ||
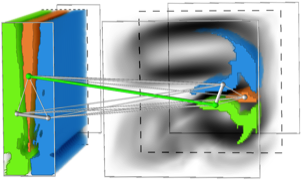
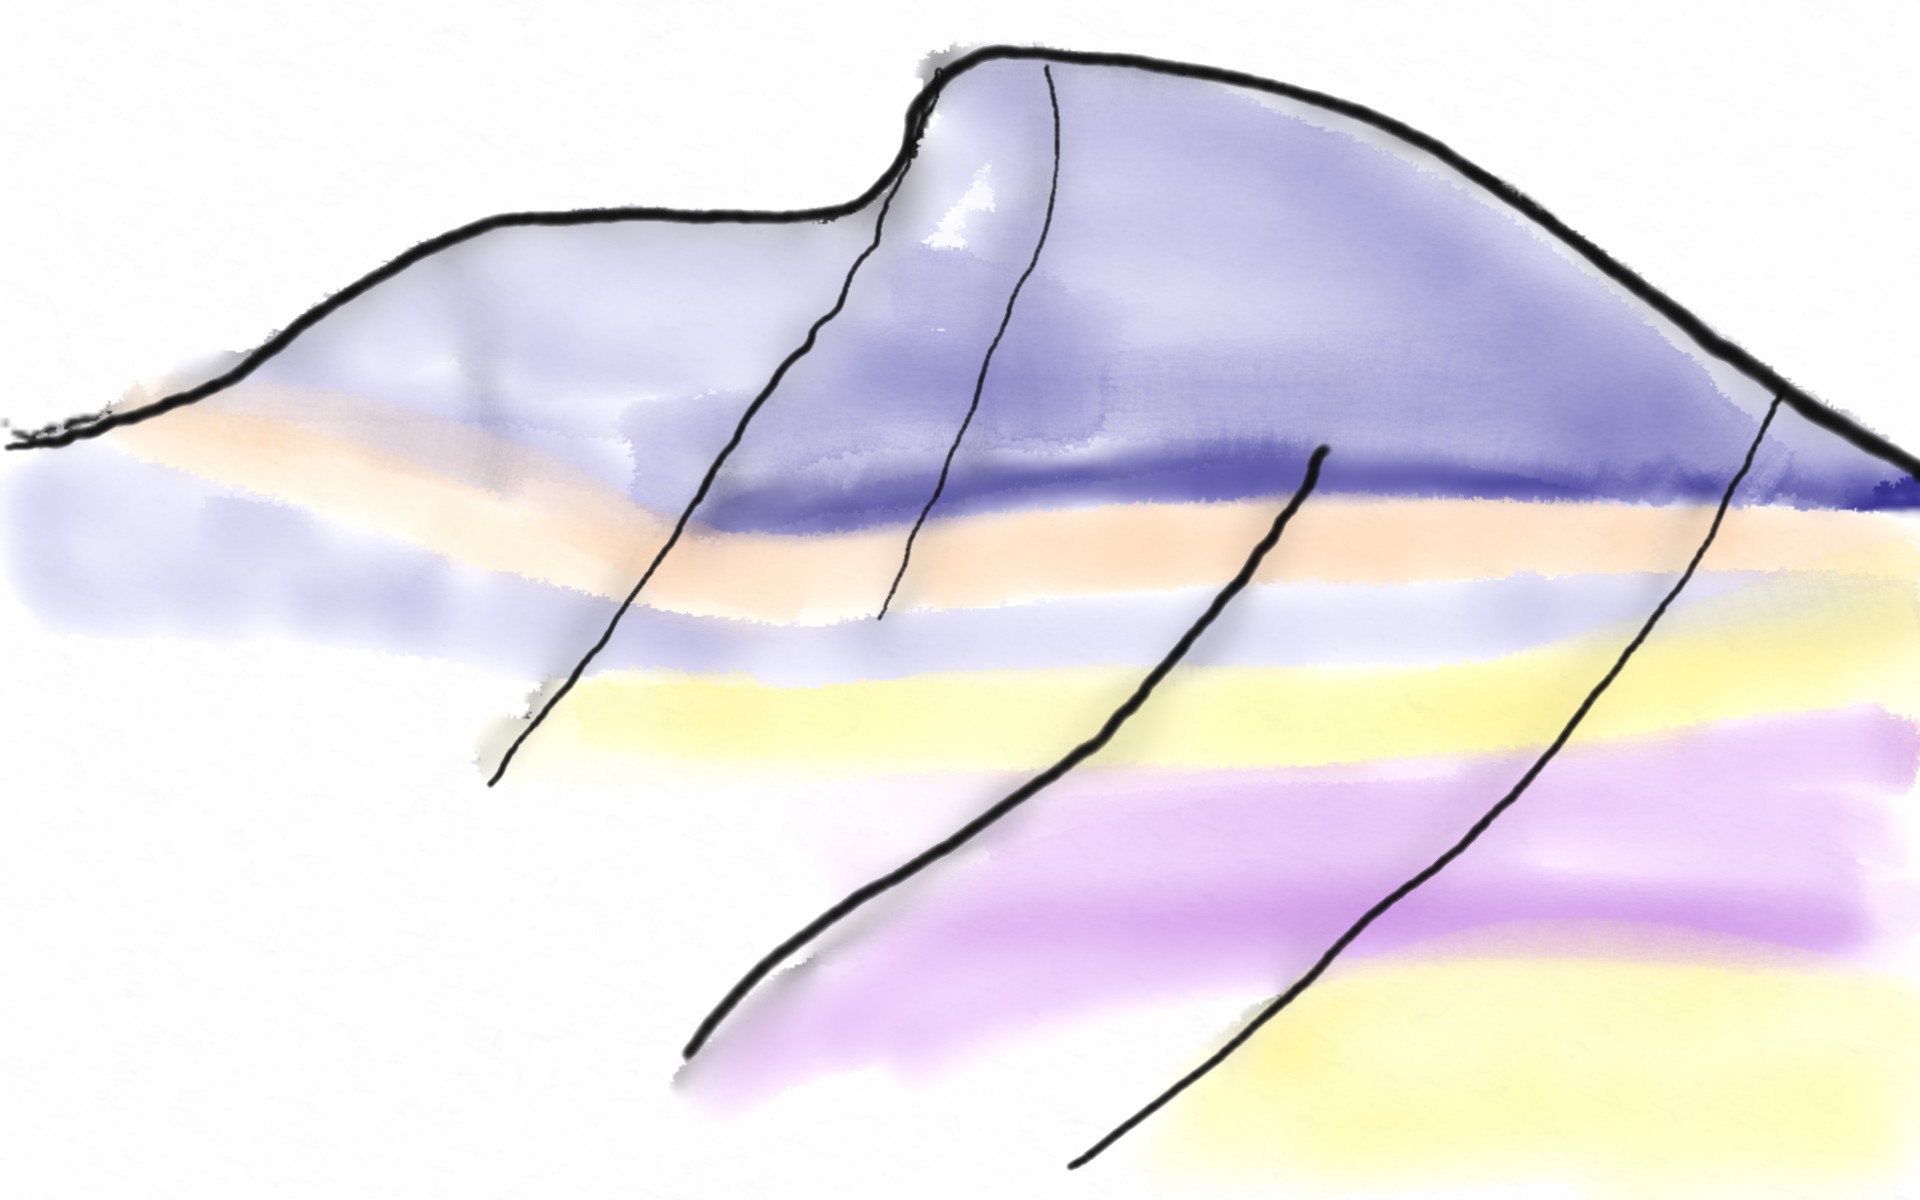
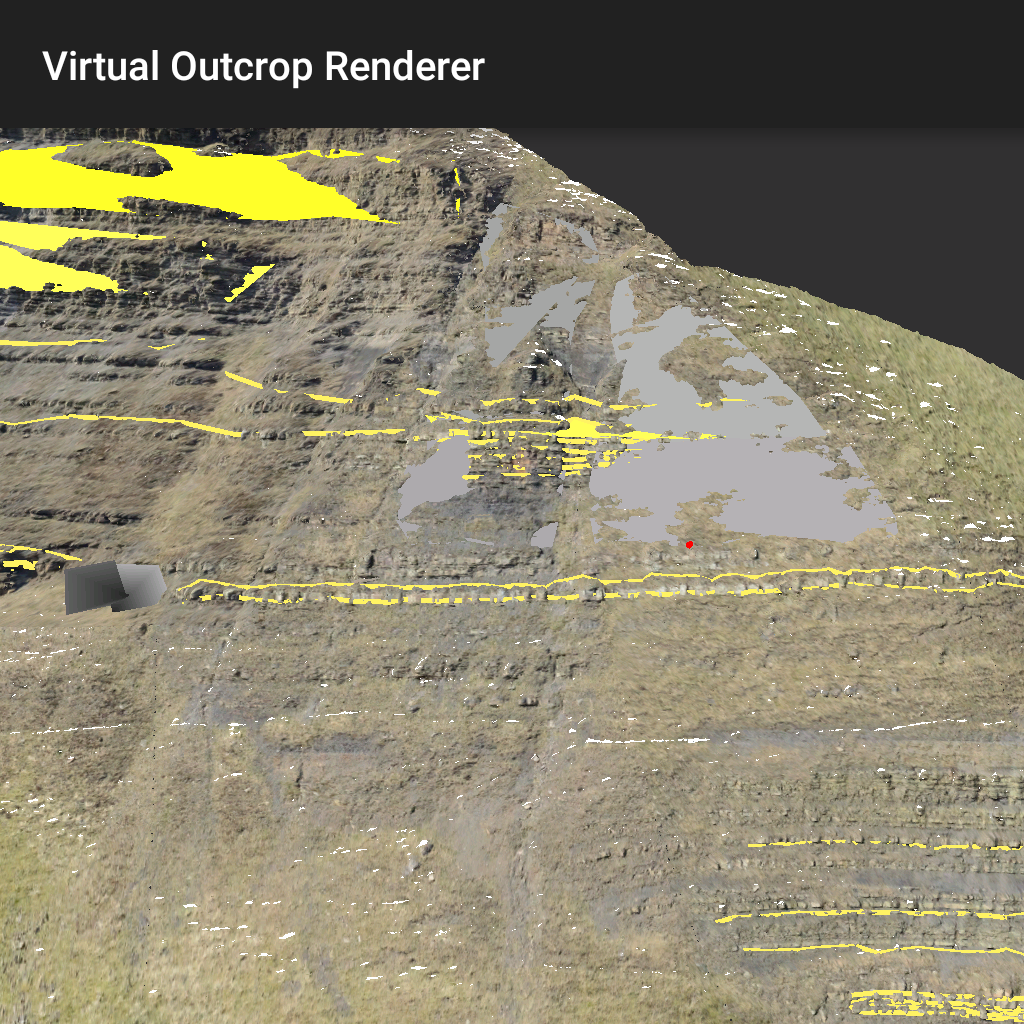 Field-based geological interpretations on a mobile device via the GRIT application. | 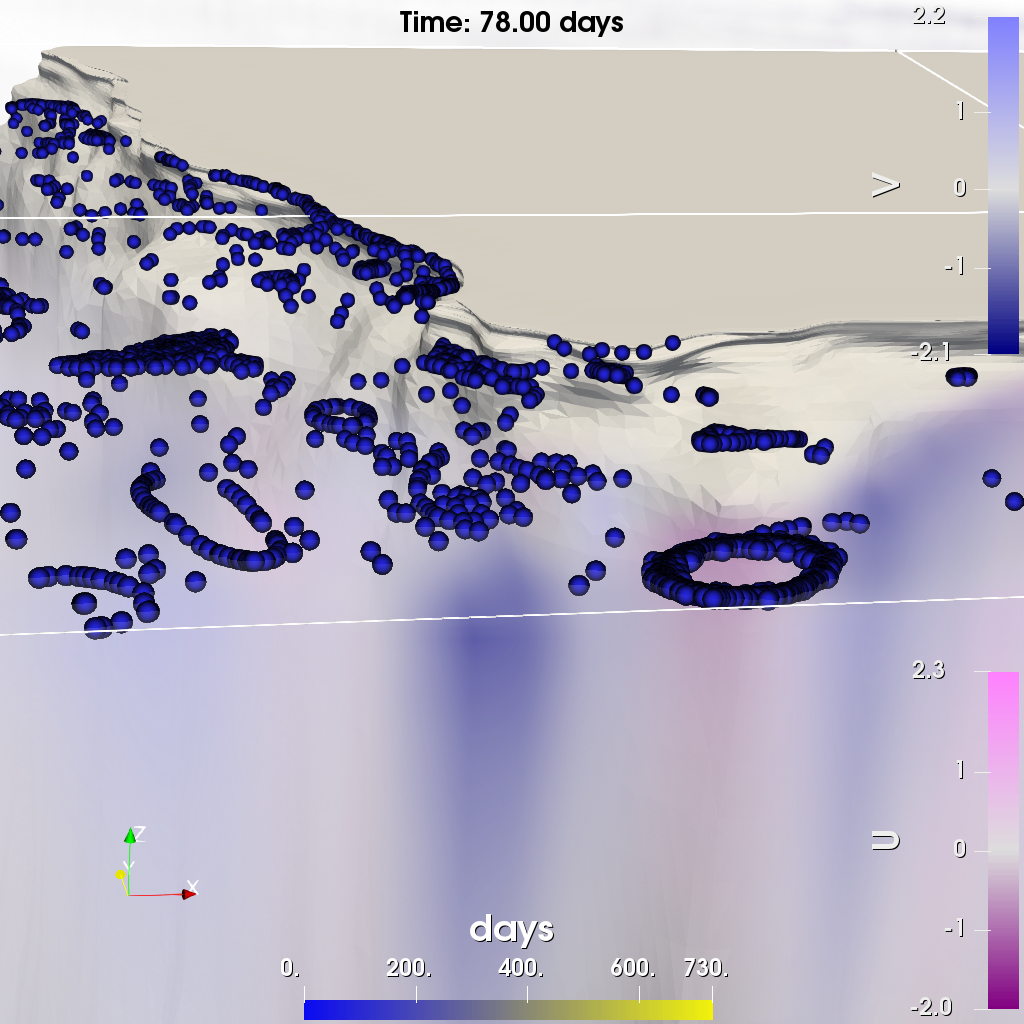 Co-visualization of Eulerian hydrodynamic velocities with Lagrangian plastic-particle trajectories. |
Tracing of single-phase flow patterns from porous-media simulation ensembles.
Specializations
| Optimization and Machine Learning for Visualization Optimization and machine learning can address various visualization problems in a data-driven way. Our research uses such techniques to analyze data, identify informative visual mappings, and dynamically adapting visualization systems at runtime. | ||
| High Performance Visualization Visualization algorithms can be computationally demanding. Parallel and distributed computing enable the investigation of large data sets at interactive rates. We also work on approaches reducing computational cost by explicitly considering characteristics of the human visual system (e.g., foveated rendering). Finally, we develop in situ visualization methods processing data while it is generated to address the issue of the rate of data generation exceeding the capability for permanent storage (e.g., on supercomputers). | ||
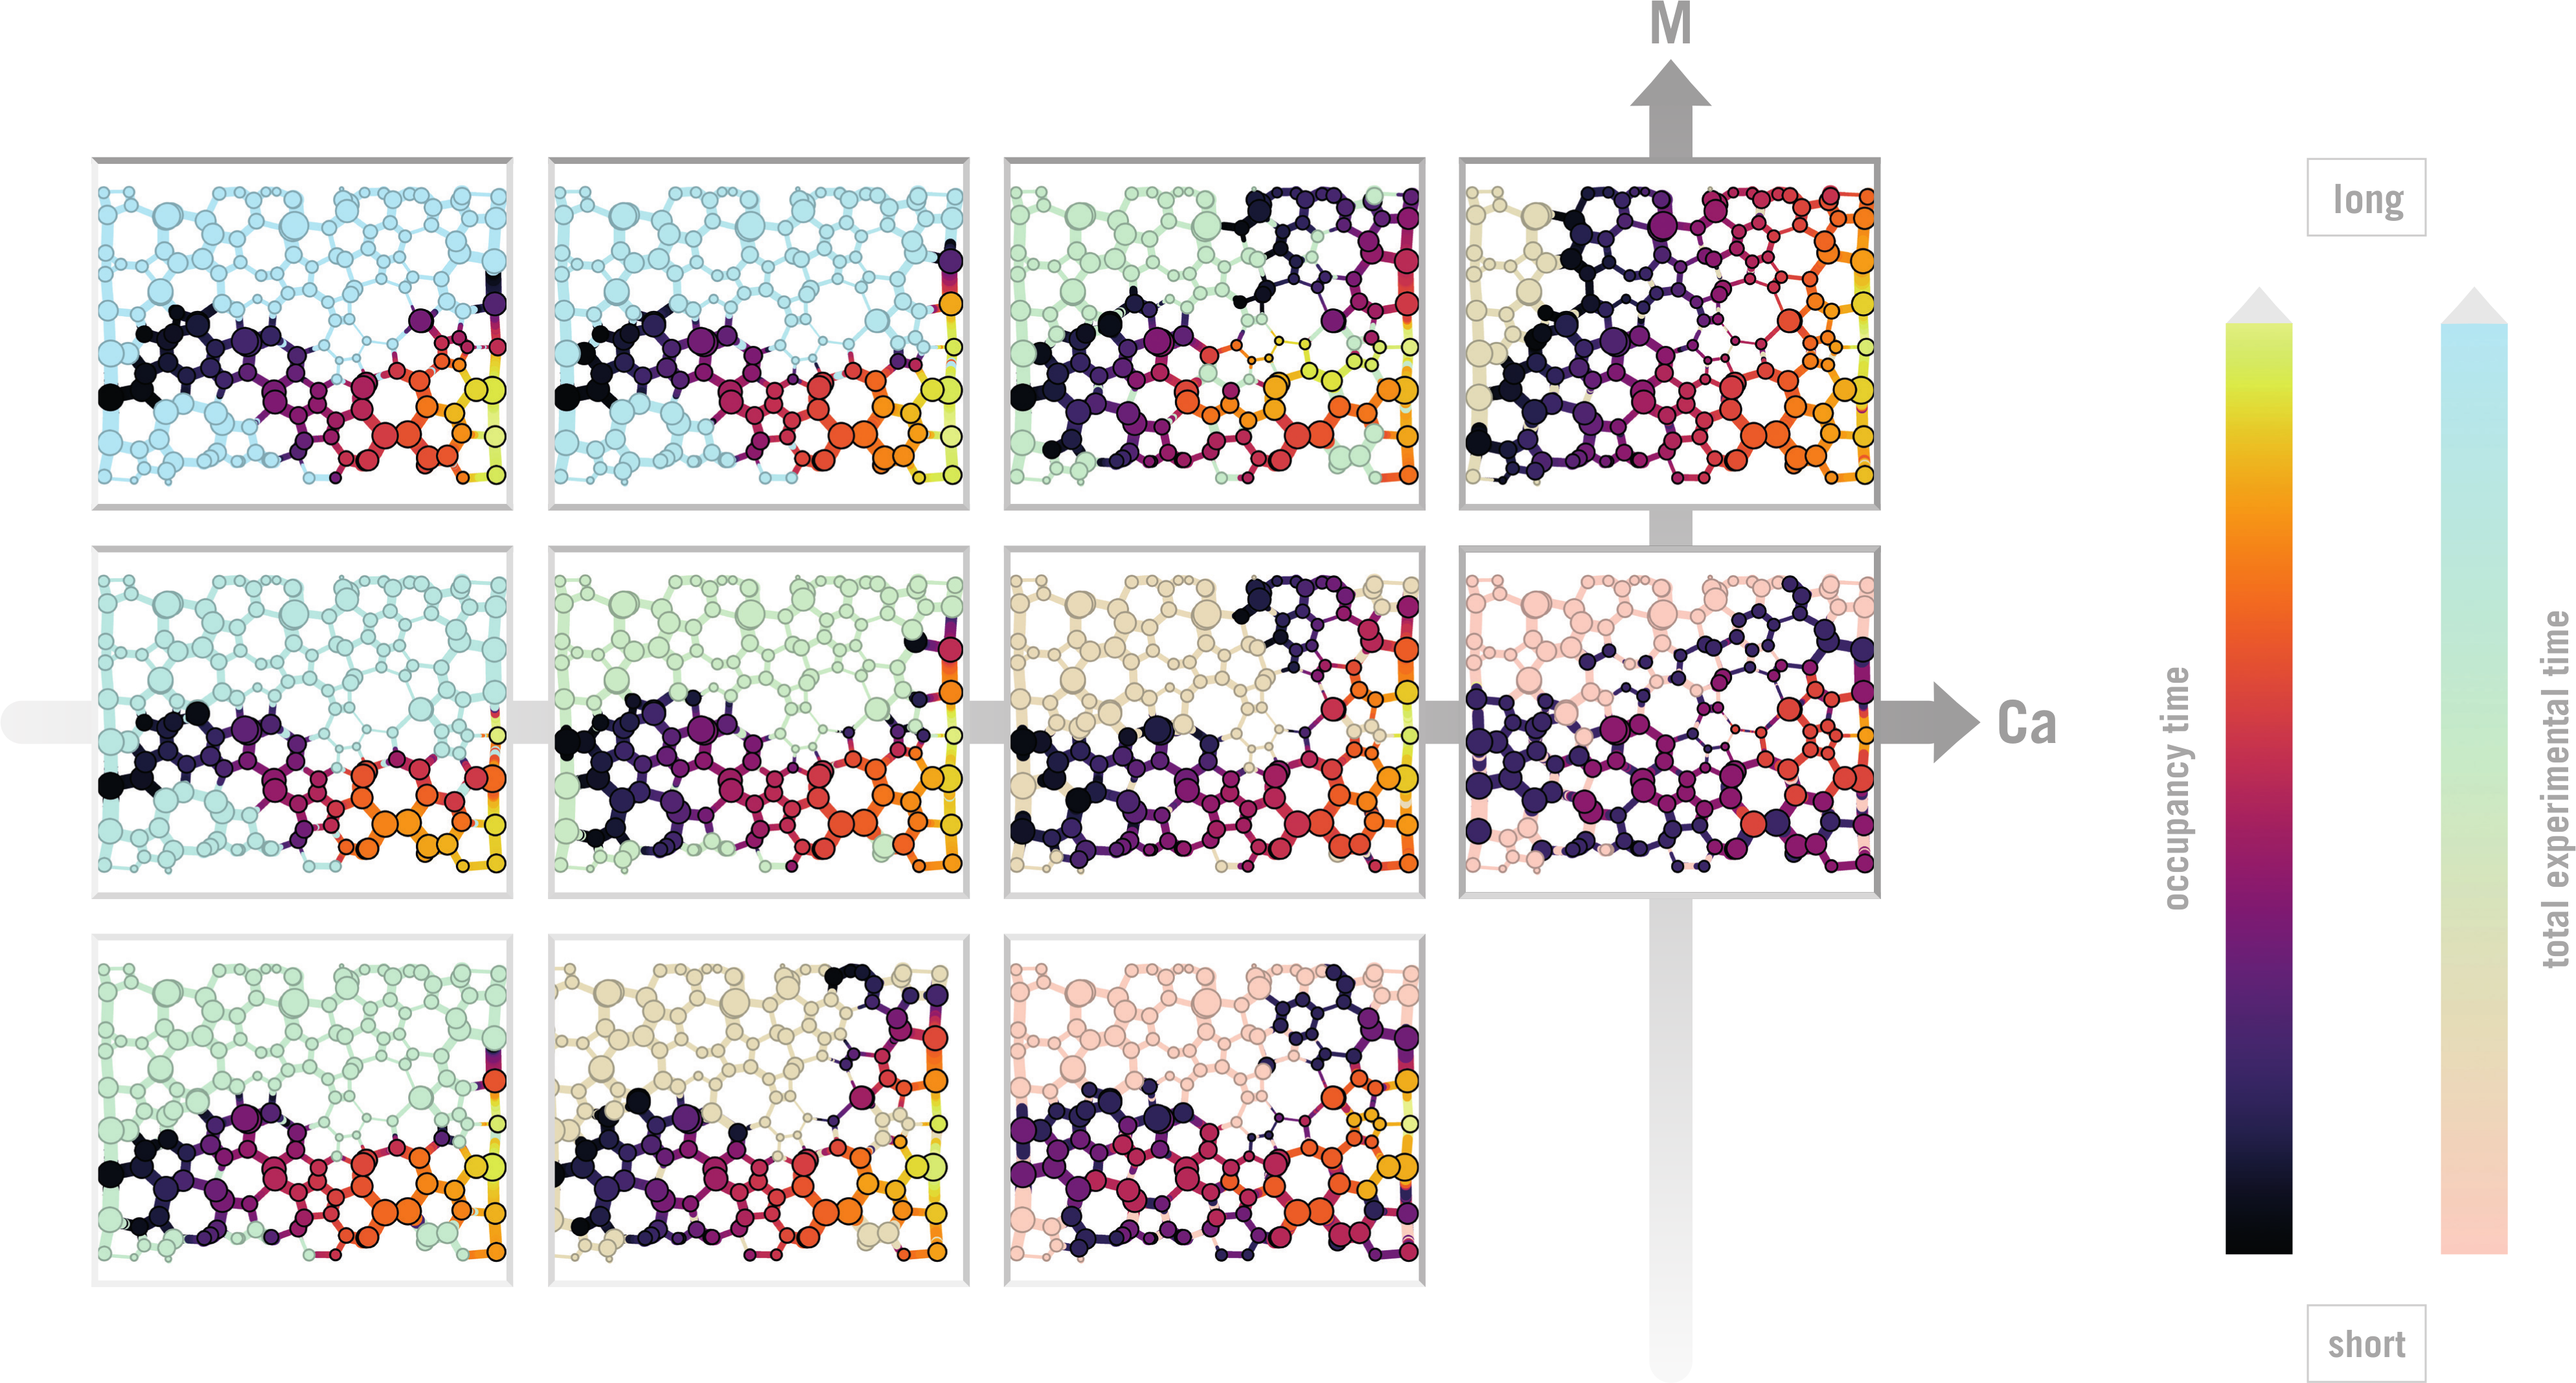
| Visualization of Multifield Data Analyzing multiple fields reflecting changes in time, simulation or experiment configuration, variables, etc. requires efficient visual abstraction. We work on different forms of aggregate representations, e.g., reducing data in time via selection or space via contours. We work both on generic and dedicated visual representations addressing specific research questions in another field (e.g., to support the understanding of fracture processes, CO2 bubble storage, and flow in porous media). | ||
| Geoscientific Visualization Visualizing geoscientific data pose distinct challenges at all stages of the visualization pipeline, be it data acquisition, filtering, mapping or rendering stage. This is due to the complexity of the analyzed data as well as the tasks that are to be performed. This domain-specific complexity is reflected by our collaborative research approach, where we develop methods for large-scale data analysis, efficient space-time filtering methods, the synthesis of stochastic simulation ensembles and adaptive rendering techniques. Novel mapping techniques to embed multivariate data in a geospatial context, and techniques to effectively explore volumetric time series interactively, are equally part of our investigation. Our interdisciplinary collaborations not only intend to validate and adapt our research to domain-specific challenges, but also further interdisciplinary education for an improved adoption of state-of-the-art geo-visualization approaches. | ||
| Visualization Design Visualization design and its conceptual research are widely known in the information visualization community. We investigate visualization design approaches for scientific visualizations to perceptually and objectively more adequate visualizations for exploration and knowledge extraction. By breaking with traditional mapping patterns, we develop new design approaches, explore domain-specific visualization design spaces, and evaluate those designs with objective and perceptually-rooted analysis methods. |
formerly headed by Prof. Dr. Jos B.T.M. Roerdink
Visualization of large data sets requires advanced techniques in image processing and segmentation, hierarchical data management, and data reduction. This covers a wide range, from classical medical imaging to simulation of natural phenomena. Data volumes generated by scientific simulations can easily grow into the range of gigabytes. In a functional neuroimaging experiment (PET, fMRI), a large number of data volumes is obtained, thus increasing data size even further.
Both the increasing size and complexity of these data ask for new techniques for interactive visualization. The possibility of interaction during evaluation will significantly reduce the time required to interpret and present results. To arrive at interactive visualization and analysis for large data sets, many techniques are available, such as auxiliary data structures; special (multiresolution) data transforms, e.g., wavelets or multiscale morphological methods; extraction of features from the volume data and visualizing the features only.
For details on these and other projects please look at the links on the menu bar on the left.