Software Visualization and Data Mining
headed by Prof. Dr. Alexandru C. Telea
Modern software systems have an increasing size and structural complexity; also, they evolve in time. Software visualization methods address the challenge of understanding and maintaining large code bases by presenting the structure, attributes, and evolution of source code in scalable and intuitive ways. We develop methods that extract and show the structural evolution of code at class, function, or statement level and that combine the visualization of software architecture diagrams with software metrics defined on groups of diagram elements. We implement our methods in tools that can be tested on real-world software systems.
Software engineering is a complex field which encompasses many activities. Software visualization can help support all these activities. It is hard to provide an exhaustive list of the potential applications. A set of sample applications include:
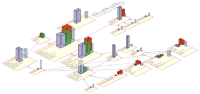
- visualization of software design (UML diagrams, software architectures)
- visualization in reverse engineering
- visualization of software repositories
- visualization of systems structure (call and dependency graphs)
- visualization of software behavior (system dynamics at runtime)
- visualization of the software build process (makefiles, compiler artifacts)
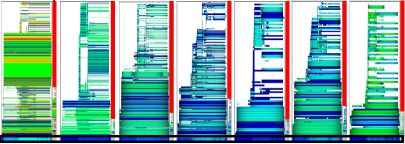
- visualization of source code (text, relations, transformations, and metrics)
Software Visual Analytics
Our general approach is to tightly combine software data-mining, data analysis, and software visualization techniques in integrated tools that favor interactive what-if exploration and hypothesis refinement. We call this approach visual software analytics.
Several overview presentations of our work on Software Visual Analytics are available below:
- Software Visual Analytics - an extended overview
- Software Visual Analytics for Testing (Dutch Testdag'13)
To learn more:
Follow the links on the left side bar to specific sub-themes.