Chapter 2: From Graphics to Visualization
Sample programs
The sample programs provided for Chapter 2 introduce basic computer graphics notions (polygon primitives, setting up the viewing system, shading, transparency, and texturing). These are demonstrated by a simple application: Rendering a 3D plot of a two-variable function.
The samples start with a minimal OpenGL application that renders a 2D height plot. Next, additional OpenGL rendering options are incrementally introduced in each sample.
Each sample application is a small standalone program that can be read, compiled, and run separately from the other samples.
Sample 1: Getting started
The first sample demonstrates the minimal structure of an OpenGL application that renders the 3D plot of a two-variable function. The function graph is shown as a single-color gridded surface. The sample also introduces the Quad class that describes an OpenGL quad polygon. Finally, it shows the interaction between OpenGL and GLUT.
Sample 2: A more complex function
The second sample is identical to the first one, but shows a different, more complicated, function. Also, it uses a higher sampling rate. We see now the need for shading to understand the function graph's details.
Sample 3: Adding flat shading
The third sample adds flat shading to the graph. This also shows how we can compute polygon normals from the polygons' vertices, using cross products.

Sample 4: Adding smooth shading
The fourth extends the third one by demonstrating smooth shading. This also shows how we can compute vertex normals by averaging polygon normals that share a vertex.

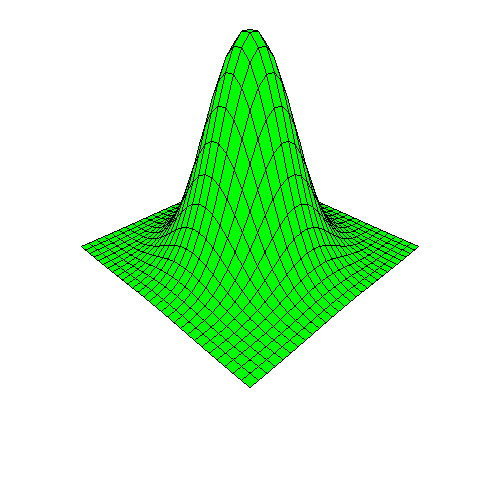
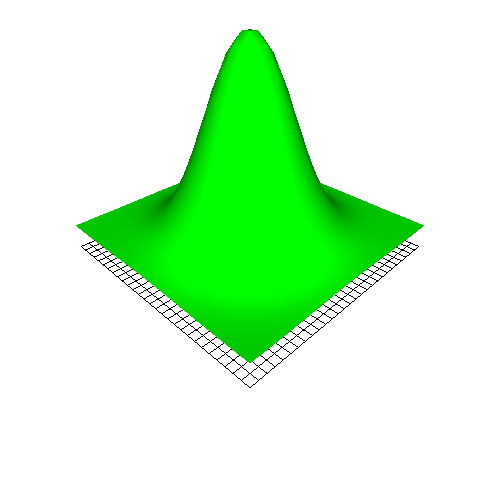
Sample 5: Drawing the domain grid
The fifth sample adds the domain grid, rendered as a wireframe structure, underneath the function graph. This shows how we can render polygon outlines.
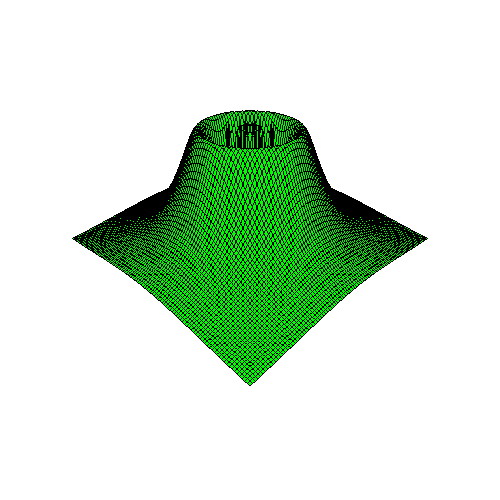
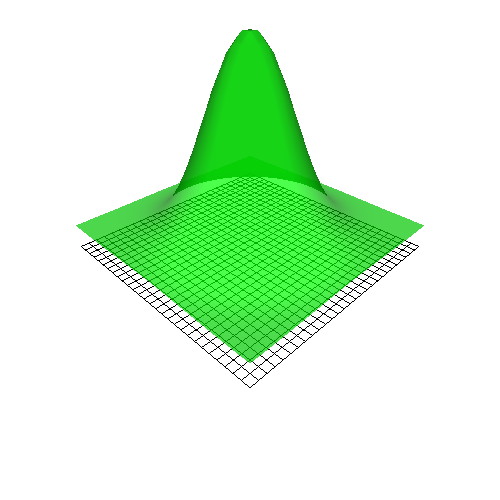
Sample 6: Adding transparency
The sixth sample extends the fifth one by drawing the graph half-transparent. This makes the grid under the graph more visible.
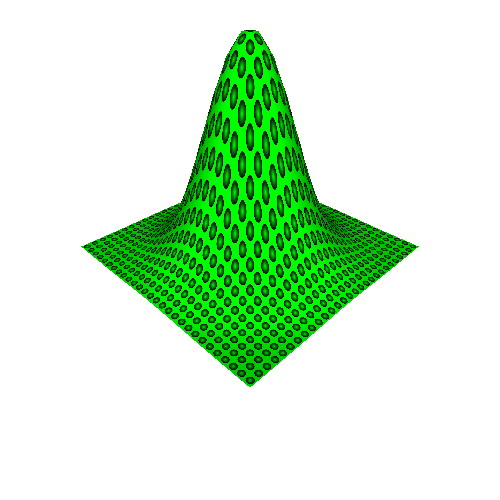
Sample 7: Adding textures
The seventh sample shows how we can add textures to a surface. It also explains how we can construct an OpenGL texture from an image stored in a file.