Chapter 4: The Visualization Pipeline
Sample programs
Providing source-code for an entire visualization system using the dataflow programming model would be counterproductive, as the design and implementation of such systems is highly complex. As such, we choose to provide here pointers to several well-known such systems which can be easily installed, offer powerful visualization functionality, are reasonably easy to learn and use, and can be obtained freely.
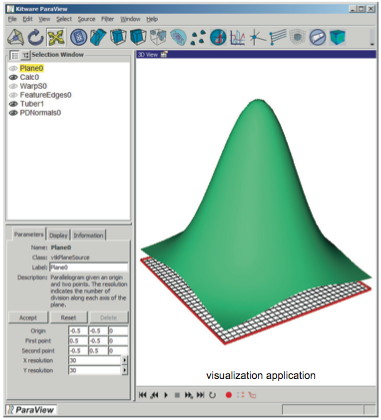
ParaView
ParaView is the tool used to create all the sample scenarios offered in this online material. Although it does not offer the same flexibility as MeVisLab or VisTrails to create complex pipelines, it is much simpler to use as a beginner. It offers a good collection of modules for general scientific visualization (e.g. isosurfaces, slicing, volume rendering, selection, and cutting).
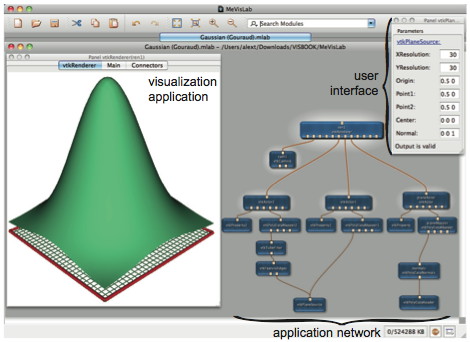
MeVisLab
MeVisLab is a professional dataflow environment for interactive visualization application construction and data exploration. It offers a fully-fledged dataflow graph editor, and a large collection of hundreds of modules, with a focus on imaging, volume-data, and medical visualization. MeVisLab also integrates several well-known visualization and 3D graphics libraries such as VTK and OpenInventor.
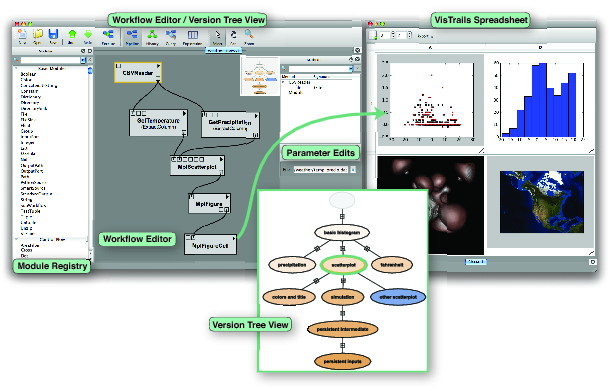
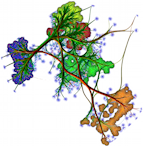
VisTrails
VisTrails is an open-source dataflow environment for visualization application construction and interactive data exploration. It is quite similar to MeVisLab, but offers a different collection of modules. A special feature of VisTrails is the support offered to examine data provenance, i.e. record and trace back through the process of data refinement and parameter-space exploration that has led to a given visualization.