EEG Visualization
Funding
University of Groningen (RUG).
People:
- PhD student Dr. Michael ten Caat (2003-2007)
Michael obtained his PhD degree on Feb. 1, 2008.
Collaboration
- prof. Natasha M. Maurits, Department of Neurology, University Medical Center Groningen.
- dr. Monicque M. Lorist, Experimental and Work Psychology, University of Groningen.
- Neuroimaging Center (NIC) of the research school BCN (Behavioral and Cognitive Neurosciences)
Project goal
This project uses techniques from information visualization to explore time-varying multichannel EEG data. Electroencephalography (EEG) is the oldest noninvasive functional neuroimaging technique. Traditional EEG visualizations are not tailored for the two major technological improvements which lie at the basis of this thesis. First, the number of EEG electrodes that can be attached to the human scalp increases, improving the spatial resolution. Second, improving computers increase automated signal processing possibilities. This thesis introduces two basic new visualizations designed for the improved EEG:
- For time domain visualization, we proposed the tiled parallel coordinate
(TPC) map, based on the parallel coordinate method and making use of a tiled organization. This tiled organization employs a two-dimensional row-column representation, rather than a one-dimensional arrangement in columns as used for classical parallel coordinates.
- For frequency domain visualization (EEG coherence), we introduced
functional unit maps for individual analysis, in combination with two group maps.
A typical visualization of EEG coherence is a network layout, with points representing electrodes and links between points representing significant coherences between electrode signals. A drawback of this layout is its visual clutter when the number of electrodes becomes large. To reduce clutter, we introduced the concept of functional unit (FU) as a data-driven region of interest. A FU is a spatially connected set of electrodes recording pairwise significantly coherent signals. To detect FUs, we developed a very efficient computational method, thus making interactive visualization of multichannel EEG coherence data possible.
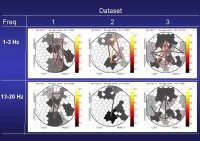
An example is shown in the figure below. Brain responses were collected from three subjects using an EEG cap with 119 scalp electrodes. During a so-called P300 experiment, each participant was instructed to count and report the number of (rare) target tones of 2000 Hz, alternated with standard tones of 1000 Hz which were to be ignored. In the visualization, a cell is associated to each electrode and all cells belonging to a FU have a corresponding colour. Lines connect FU centers if the inter-FU coherence exceeds a significance threshold. The colour of a line depends on the inter-FU coherence. Shown are FU maps for target stimuli data, with FUs larger than 5 cells, for the 1-3Hz EEG frequency band (top row) and for 13-20Hz (bottom row), for three datasets. To enable group comparisons, we also introduced two group maps. First, the group mean coherence map preserves dominant features from a collection of individual FU maps. Second, the group FU size map visualizes the average FU size per electrode across a collection of individual FU maps. We applied our visualization method to two case studies, one on ageing and another one on mental fatigue. Our method leads to a selection of coherences of interest taking full advantage of the recordings under investigation. Most importantly, the presented visualization of group FU maps provides a very economical data summary of massive amounts of experimental data, which would be very difficult and time-consuming to assess otherwise.

Selected publications
- Monicque M. Lorist, Eniko Bezdan, Michael ten Caat , Mark M. Span, Jos B. T. M. Roerdink, and Natasha M. Maurits (2009) The influence of mental fatigue and motivation on task switching; an EEG coherence study. Brain Research, 1270:95–106, 2009.
- Michael ten Caat, Monicque M. Lorist, Eniko Bezdan , Jos B. T. M. Roerdink, and Natasha M. Maurits (2008) High-Density EEG Coherence Analysis Using Functional Units Applied to Mental Fatigue. J. Neuroscience Methods, 171(2):271–278, 2008.
- Michael ten Caat, Natasha M. Maurits, and Jos B. T. M. Roerdink (2008) Data-Driven Visualization and Group Analysis of Multichannel EEG Coherence with Functional Units. IEEE Trans. Visualization and Computer Graphics, 14(4):756–771, 2008.
- Michael ten Caat, Natasha M. Maurits, and Jos B. T. M. Roerdink (2007) Design and Evaluation of Tiled Parallel Coordinate Visualization of Multichannel EEG Data. IEEE Trans. Visualization and Computer Graphics, 13(1):70–79, 2007.