Interactive Computer Graphics & Visualization
Interactive Visualization
headed by Dr. mat. nat. Christian Kehl
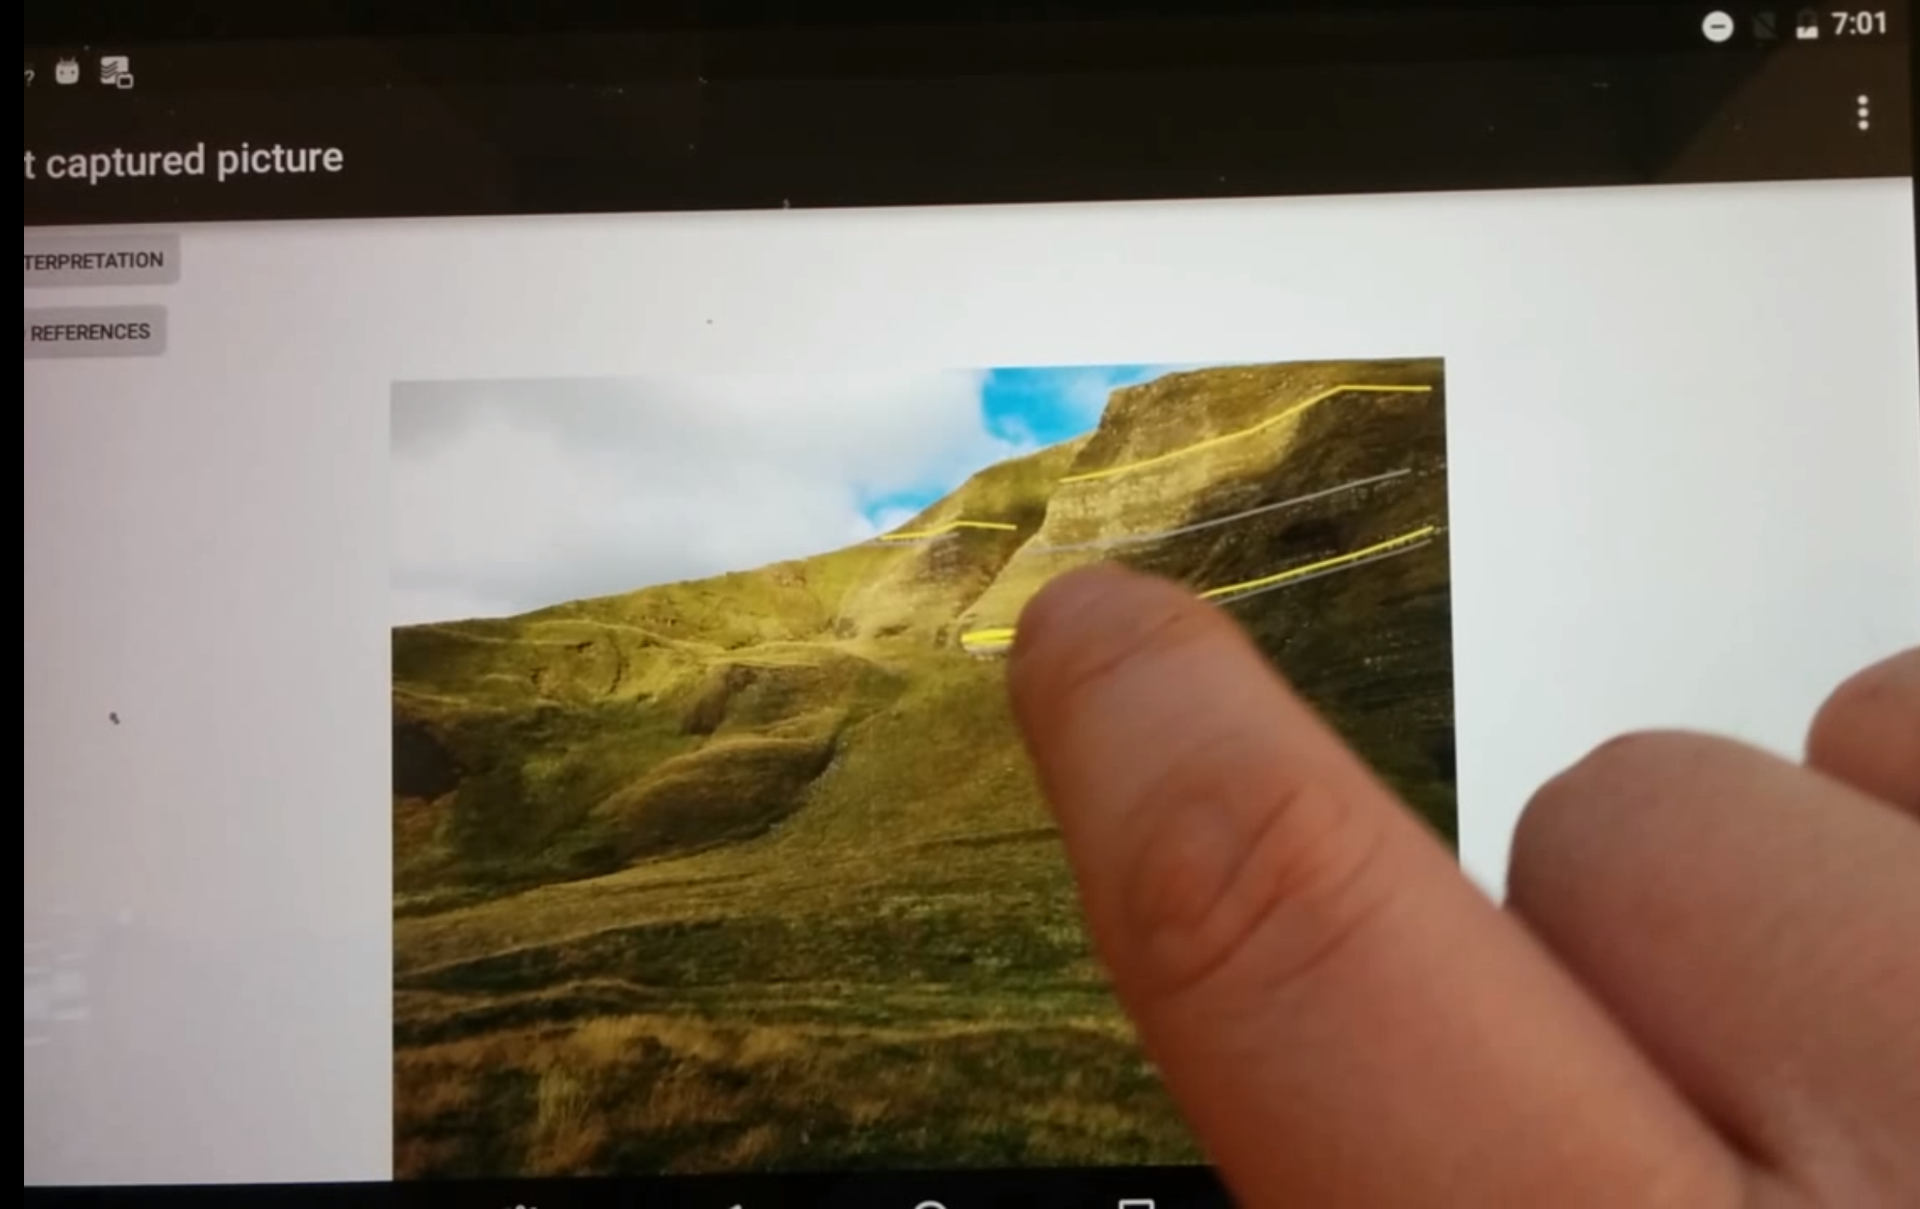
The process of generating expressive visualizations is inherently interactive, requiring iterative stages in setting up visual mappings of the data for a collision-free result image. Moreover, visual exploration requires the continuous adaptation of color maps or transfer functions, data selection- and filtering by visual means, the organization of zoom-and-overview functions, and the orchestration of multiple views Those challenges further expand when traversing to immersive, mixed reality (MR) visualizations, massive data visualizations, or the visualization on distributed, mobile smart-devices (e.g. phones & tablets).
Within our research, we investigate the impact of interaction design on interactive visualizations and user interface (UI) design guidelines for fit-for-purpose interaction. Here, a particular focus are interaction principles in challenging compute environments, such as distributed visualizations, MR and mobile devices. Defining, quantifying and measuring visual affordance for the individual use cases is hereby equally important as interactive layouts, such as user- or object-centric interfaces. Domain-specific paradigms that are aligned to established lab- or field procedures hereby help to translate abstract concepts to applications that are used and evaluated by practicing experts.
Interactive Computer Graphics
formerly headed by Dr. Tobias Isenberg
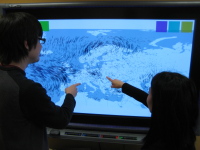
We investigate how to allow intuitive interaction with rendered images, on large, touch-sensitive displays for single or multiple people, to allow them to be creative and achieve their goals without a limiting interface. For example, for non-photorealistic rendering we have used hand postures to make it possible to create your own strokes and stylize them, while being able to interact with the interface without the use of buttons or menus:
We also explore how to use interaction in scientific visualization tasks such as for exploring two-dimensional vector data:
Or we use frame gestures to provide full 7DOF control to explore 3D datasets:
For details on these and other projects please look at the links on the bar on the left.