Skeleton-based Edge Bundling
Edge bundling is a recent, increasingly promising, technique which generates graph layouts of limited clutter. Bundled layouts can be used to get insight into the coarse-scale structure of networks, geographical maps, and software systems.
An image perspective on bundling
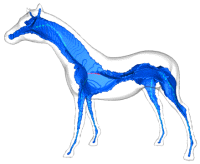
Consider the drawing of a set of edges in a given graph. We ask ourselves: What is a simple curve that describes this edge set in a compact, intuitive way? If we regard the edges' drawing as an image, the answer is well known from image analysis: The skeleton of the drawing, which is locally centered with respect to the drawing, and captures the drawing's shape. The skeleton can be seen as the extreme bundling of this edge set.
Skeleton-based edge bundling (SBEB)
We use the above idea to create edge bundlings of a graph G, as follows.
- we split G into sets of similar-direction edges, using graph clustering
- we create an image from each cluster by blurring its edges and thresholding the result (similar to morphological dilation)
- we compute the skeleton S of the above image
- we attract the edges towards S
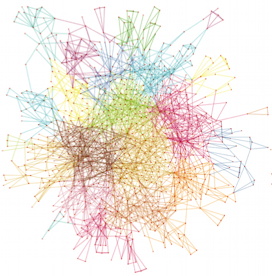
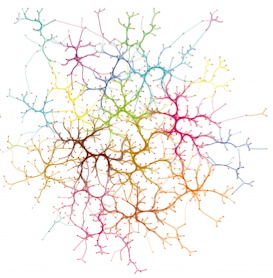
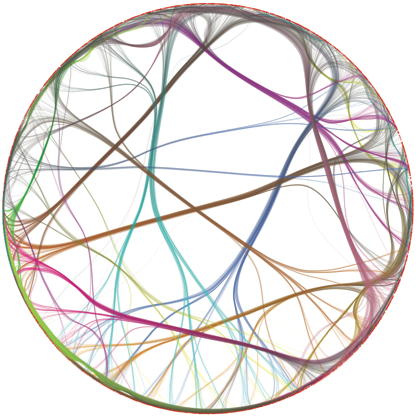
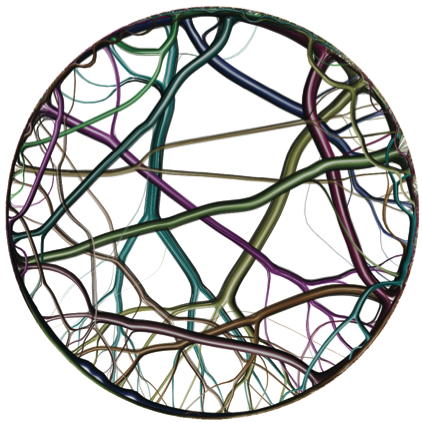
The left image above shows a social network of poker players. Edges are drawn straight. Colors indicate edge clusters. The right image above shows the SBEB rendering for this graph. The organic look created by bundling exposes the clique structure of poker partners in the graph.
Performance
SBEB can be efficiently implemented. Skeleton can be computed by the CPU-based AFMM method or our recent CUDA-based method (follow the links to access the source code). Edges are attracted to the skeleton simply moving them in the feature transform of S, which both above methods compute by default. Although SBEB requires skeletonization of hundreds of images, the speed of our skeleton methods allows SBEB to bundle large graphs in a matter of seconds on recent GPUs.
Examples
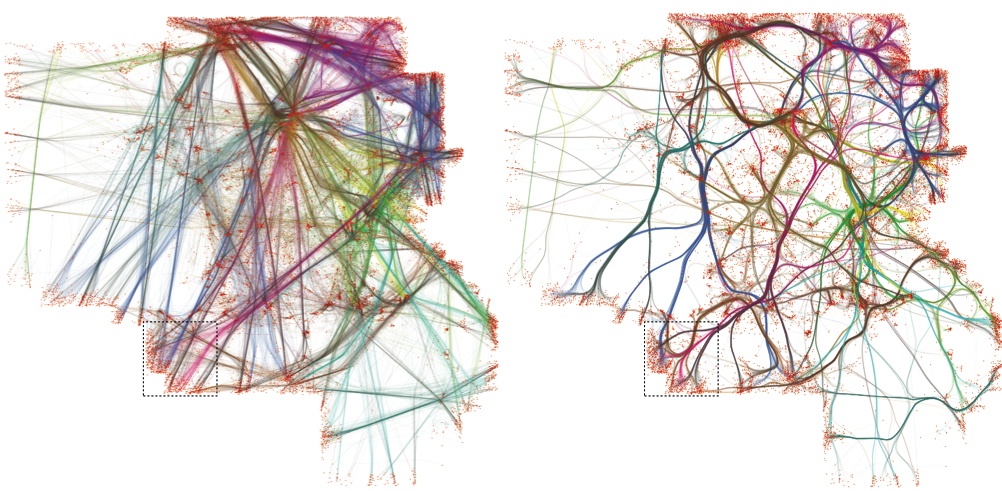
The graph below contains 17400 flight routes over the French territory. The left image shows the graph without bundling. The right image shows how SBEB bundles nearby flights and emphasizes the network-like structure of the airline connections.
The graph below encodes dependencies in a software system (1024 nodes, 4021 edges. The left image shows the SBEB bundling. The result is very similar to the classical hierarchical edge bundling [Holten, 2006], but we use no hierarchical data to compute it. The right image shows a cushion-style rendering which emphasizes coarse-scale bundles by shading. The result is very similar to image-based edge bundling, but computed now in real-time.
Publications
The SBEB is described in this paper. Further examples, which also demonstrate interactive navigation, are shown in a separate project.