Test
Explaining 3D Multidimensional Projections
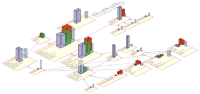
Projections are a well-known technique for reducing large multidimensional datasets to datasets having two or three dimensions. Such reduced datasets can next be visualized as 2D or 3D scatterplots, to support tasks such as discovering outliers, groups of similar observations, or correlated dimensions.
Making 3D projections usable
While more exact than 2D projections, 3D projections are much harder to interpret. Users cannot easily understand the meaning of the projected point patterns in terms of the original high-dimensional variables.
We address this by enhancing classical 3D projection scatterplots with several interaction mechanisms:
- biplot axes show the variation in the 3D space of the original dimensions, and help finding independent and correlated dimensions;
- axis legends show which dimensions we can well read in the 3D plot along its x and y axes, and which we cannot;
- viewpoint legends show which dimensions we can best explore from all possible viewpoints.
References
To learn more, see our paper Explaining three-dimensional dimensionality reduction plots (D. Coimbra, R. Martins, T. Neves, A. Telea, F. Paulovich), Information Visualization 15(2), 2016, available here.
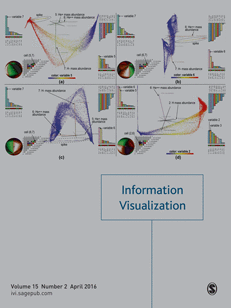
Cover image
Our work has been featured on the cover of the Information Visualization journal, volume 15, issue 2 (April 2016)