Test
Visualization of Software Metrics and Architectures
Software architectures, coming as UML or component diagrams, are an essential ingredient of all modern software engineering projects. Such diagrams are produced either in the design phase of a system or in the maintenance phase, via reverse-engineering techniques.
Software metrics are another essential ingredient of system architecting. While diagrams help understanding the system's structure, metrics such as size, complexity, cohesion, and coupling help measuring the maintainability, testability, and evolvability of the studied system. Within this topic, we study how to visually combine diagrams and metrics for a better understanding of a software system.
Visualization of element-level metrics
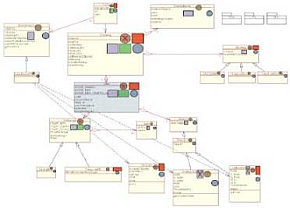
Software metrics can be computed at the level of diagram elements, such as classes in a UML class diagram. The following image, created with the interactive UML tool MetricView, shows several class-level metrics overlaid on a typical UML class diagram, using icons such as bar graphs and pie charts. Icons placed in the same position across different classes represent the same metric. This type of image allows comparing the same metric over different diagram elements and also comparing different metrics over the same diagram element.
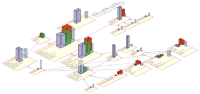
Here is the same image, now viewed in 3D. Icon heights represent metric values. This image is similar to visualizations produced by systems such as CodeCity and sv3D.
Areas of interest
Often, architects need to group diagram elements related to a single aspect, such as "all performance-critical elements" or "all graphics-related elements". We call such a group an area of interest.
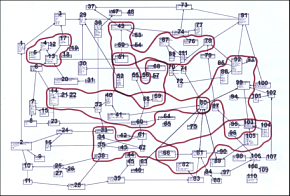
Modifying the diagram layout is not an option, as there are many such groups, which possibly overlap, and may change in time. We developed a technique that shows areas of interest by imitating the way humans actually drawn them with pen on paper. The following image shows a set of human-drawn areas of interest, marked in red.
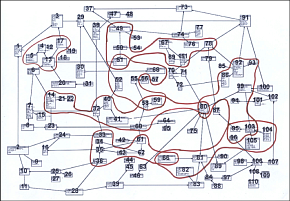
...and the following image shows the same areas of interest, now drawn by our method. The two images share the same look-and-feel.
The technique used to draw this area, described here has obtained the best paper award at ACM SOFTVIS 2006.
Member-level metrics
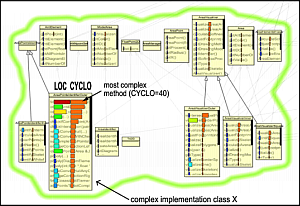
Metrics can be computed not only on diagram elements such as classes, but on element fields, such as class methods and members. The next image shows two such metrics (lines of code and cyclomatic complexity) visualized atop of a UML class diagram using a modified table lens technique. The table columns are sorted on complexity, making it possible to find the most complex methods and also see how complexity correlates with size (lines of code).
Area-level metrics
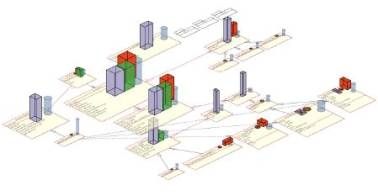
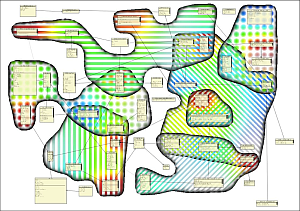
Metrics can also bear a relation with areas of interest. The following diagram shows a UML class diagram with 7 areas of interest. Each class can have a metric value within each area it is part of. Metrics and their relationships to areas are visualized using colored textures - one texture pattern per area, and a blue-to-red colormap to show metric values. Pattern intersections denote area overlaps. Area extents are further emphasized using shading along the areas' borders.
Software
The software tool for this application can be downloaded here.
Users
This software was developed in cooperation with the Trust4All European Research project of the ITEA (Information Technology for European Advancement) Organization.