Test
Visual analysis of build dependencies
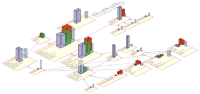
Software source code has to be built. This includes compilation and linking, and is supported by tools such as makefiles. Fast builds are essential for fast development-test-debug-release cycles. In agile development and extreme programming, these cycles have to be executed often on a daily basis.
However, in large software projects, even a small change in the code can cause tremendous build times. We call this the build cost. Moreover, some changes can massively increase the build cost. We call this the build impact. This is particularly a problem when large, multi-site teams work on the same code base.
Architects of such projects are interested to understand how to
- model and predict the build cost and build impact
- easily find the build bottlenecks in a large system
- find ways to refactor a code base to decrease build costs and impacts
Build analyzer
In this project, we studied the build cost and impact of large C and C++ software code bases. We propose a simple but accurate build cost and impact model, based on the include relations between headers and source files (details here).
The model extracts a system-wide dependency graph using our own C/C++ static analyzer. The cost and impact of any file or subsystem based on simple graph traversals that can be evaluated in real-time and saved in an SQL database for further analysis.
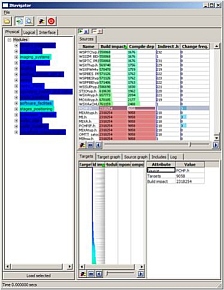
Visual build analytics
We developed a visual tool, the Build Analyzer, that supports our initial analysis goals in easy-to-use, simple ways. The system hierarchy is shown as a tree view, colored by build cost. For each subsystem, we use a table lens to show the build cost, impact, and change frequency for each file. Sorting this table shows the cost and impact distribution and allows finding the build bottlenecks. For each file, the contribution to its build cost of all its dependencies is separately shown in a second table lens. This supports deciding whether (and how) this file can be refactored to decrease costs.
Visual refactoring
Once we've found where a build bottleneck is, how to remove it? A typical solution is to refactor that bottleneck, typically a header, by
- splitting it recursively into two or more headers
- including the resulting headers in clients instead of the original one
We designed a Visual Refactor tool to help with this. The tool identifies the usage of symbols from one or more headers in their clients, and computes a recursive split of the headers so that symbols which are used together come in the same split headers. The split process is visualized as a tree using an icicle plot. We also display the refactoring benefit (decrease of build cost achieved by refactoring) and refactoring cost (number of additional include directives to add to accommodate the new headers)
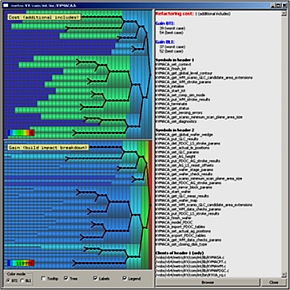
The user can then select a header split level which yields an optimal balance of the refactoring benefit and refactoring cost.