Test
Realtime Multiscale Flight Data Visualization
In the last years, the availability of large and accurate data sources describing the motion of various types of vehicles has massively increased. The availability of such movement datasets can help in a wide range of analyses and use-cases, such as Air Traffic Control (ATC), epidemics propagation, and crisis situation analysis.
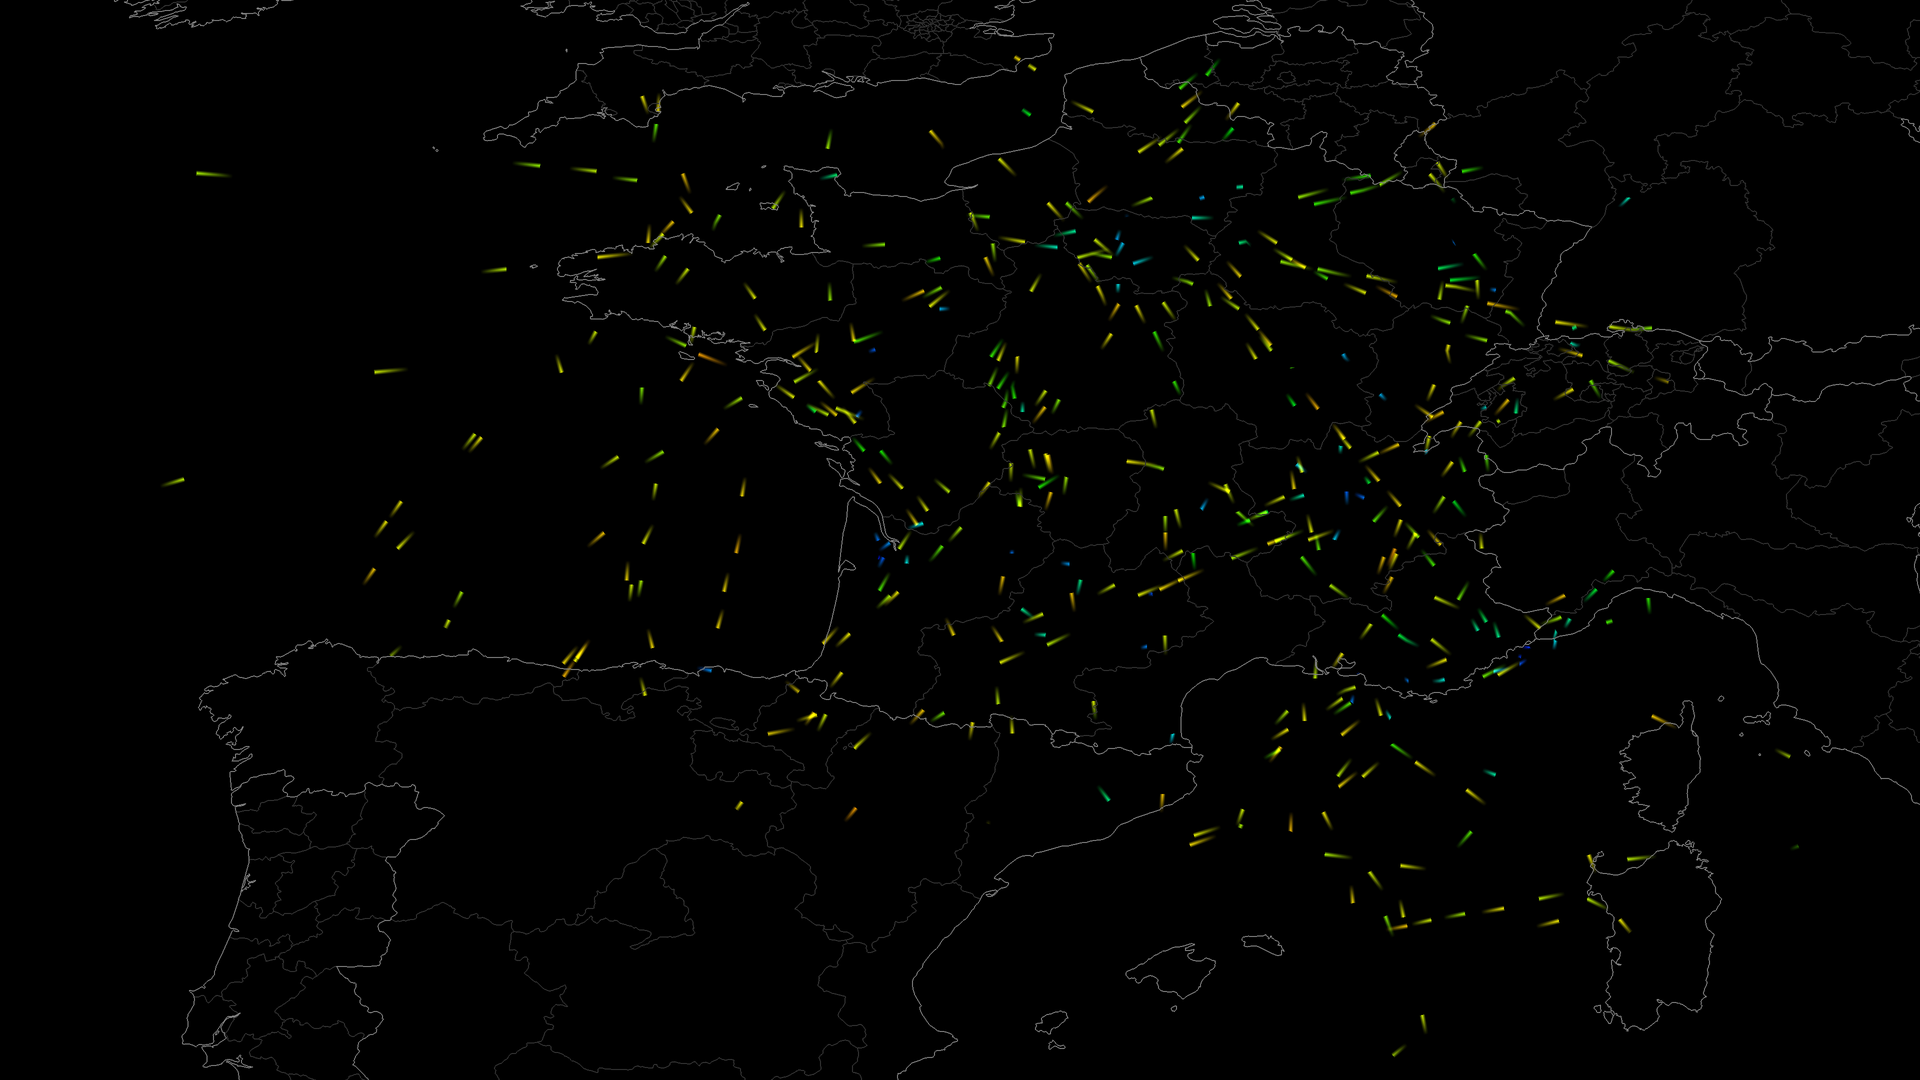
Within this context, we focus on the analysis of airplane movement datasets. Such datasets consist of several airplane trajectories, or trails, each one being in turn a temporal sequence of data points describing the position, height, velocity, flight direction vector (and possibly more attributes) of a single airplane over its flight time span.
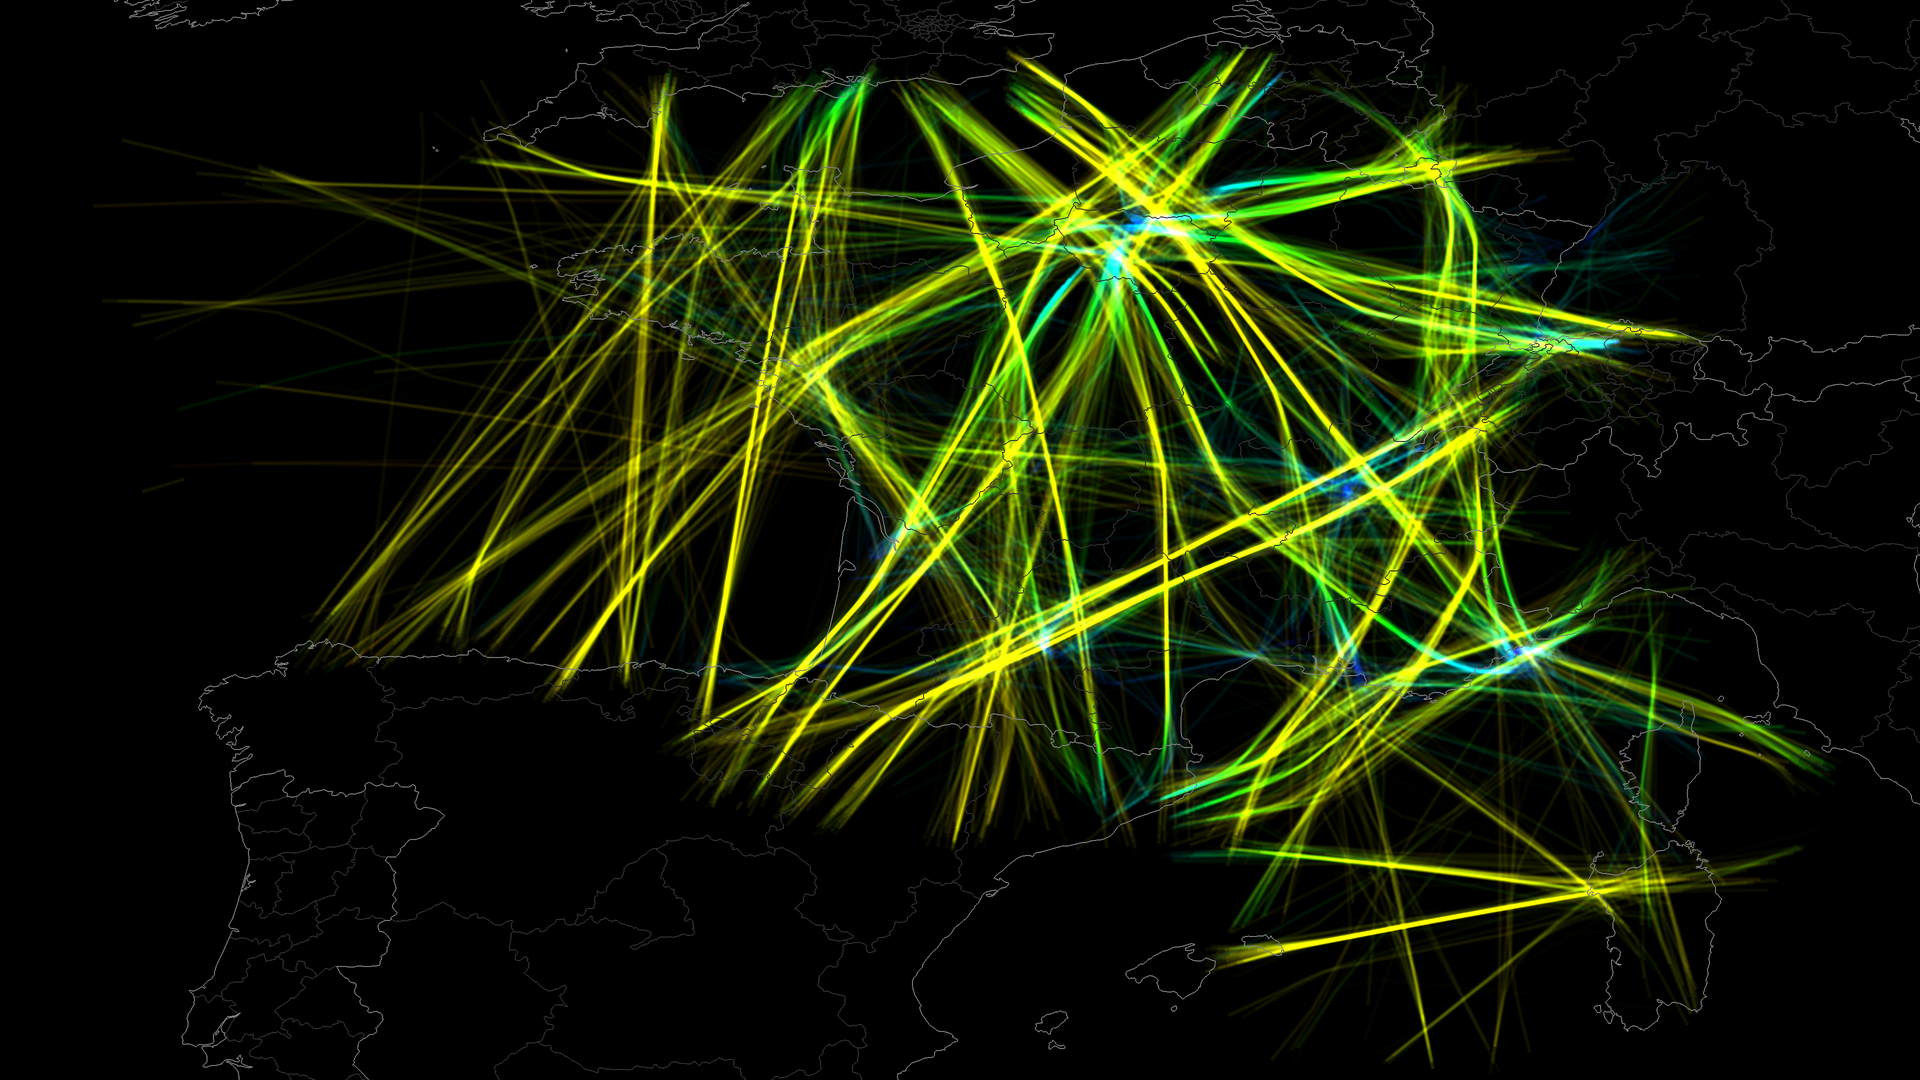
Multivariate animated visualization
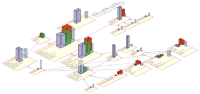
Our flight visualization offers several scales at which the data can be examined; ranging from instantaneous plane positions to trail fragments and ending with large trail sets over several days. Our main visualization techniques are animation and density maps.
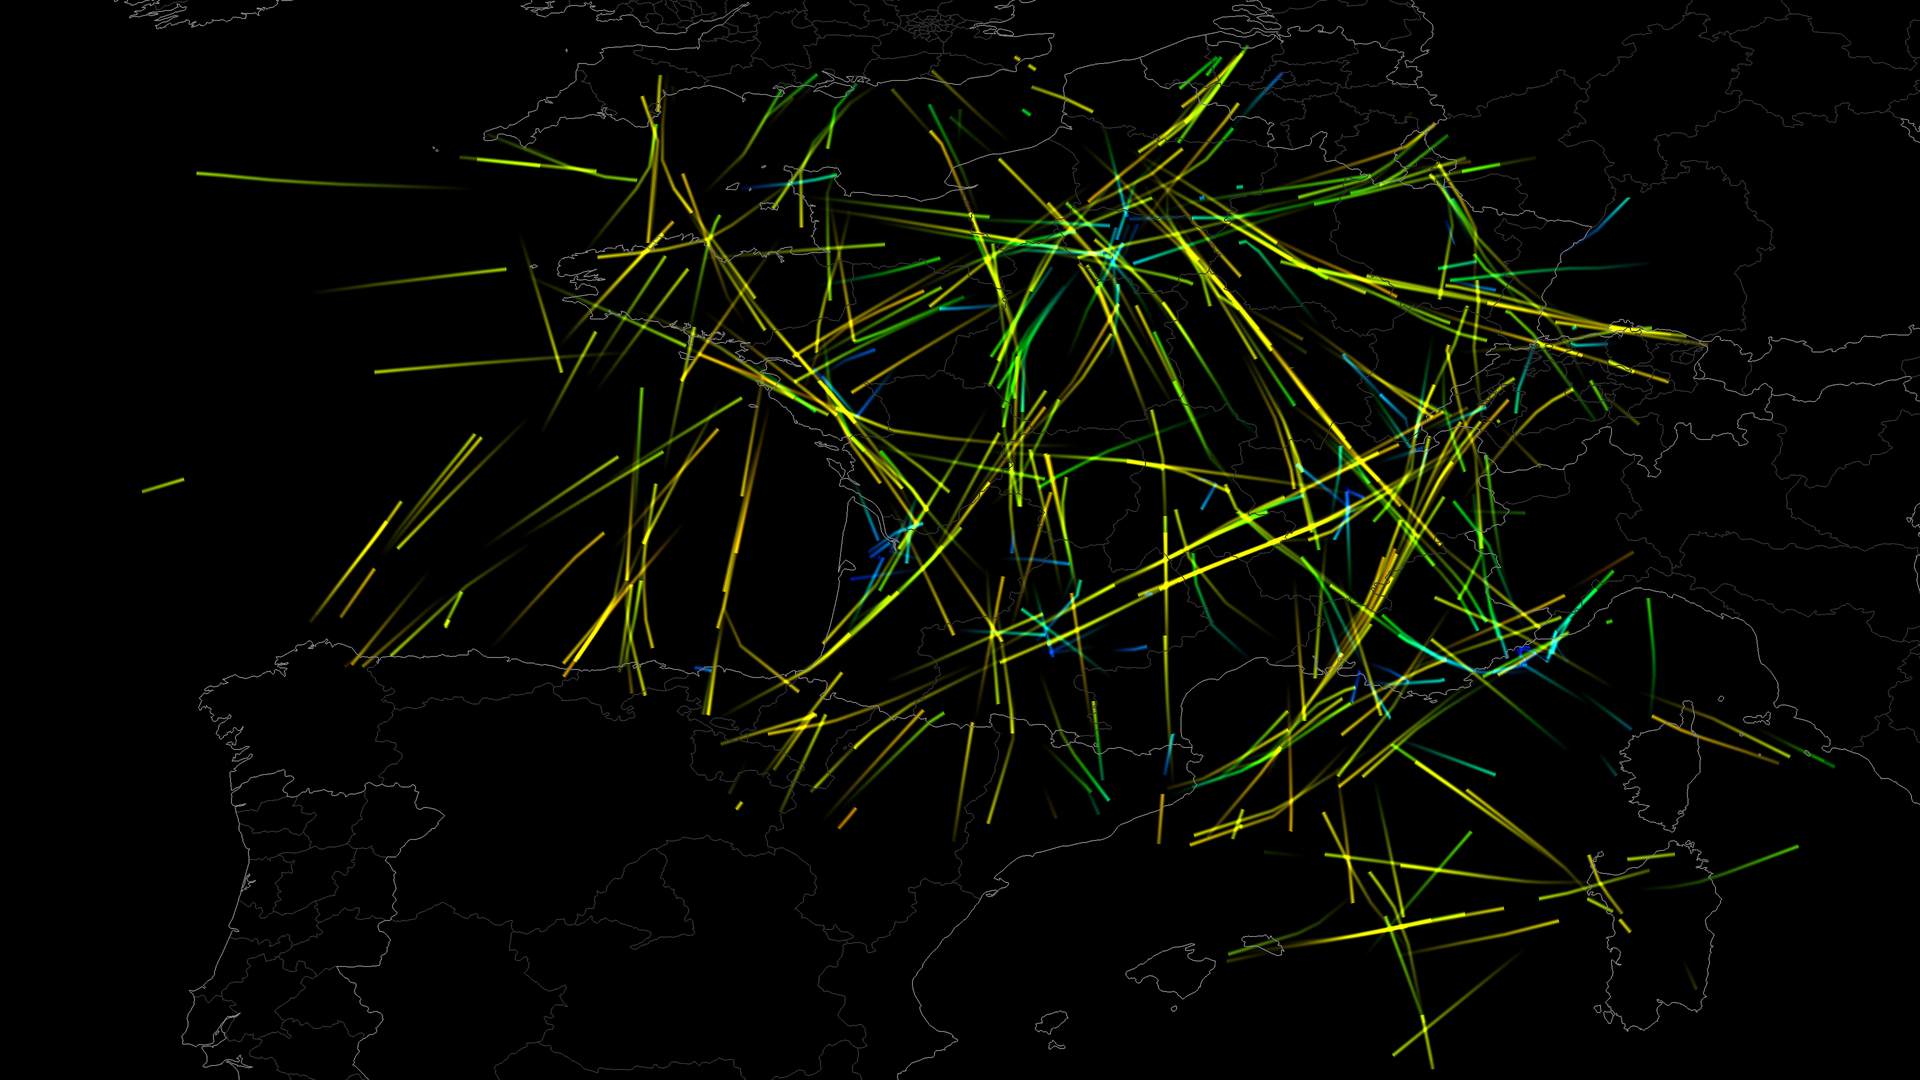
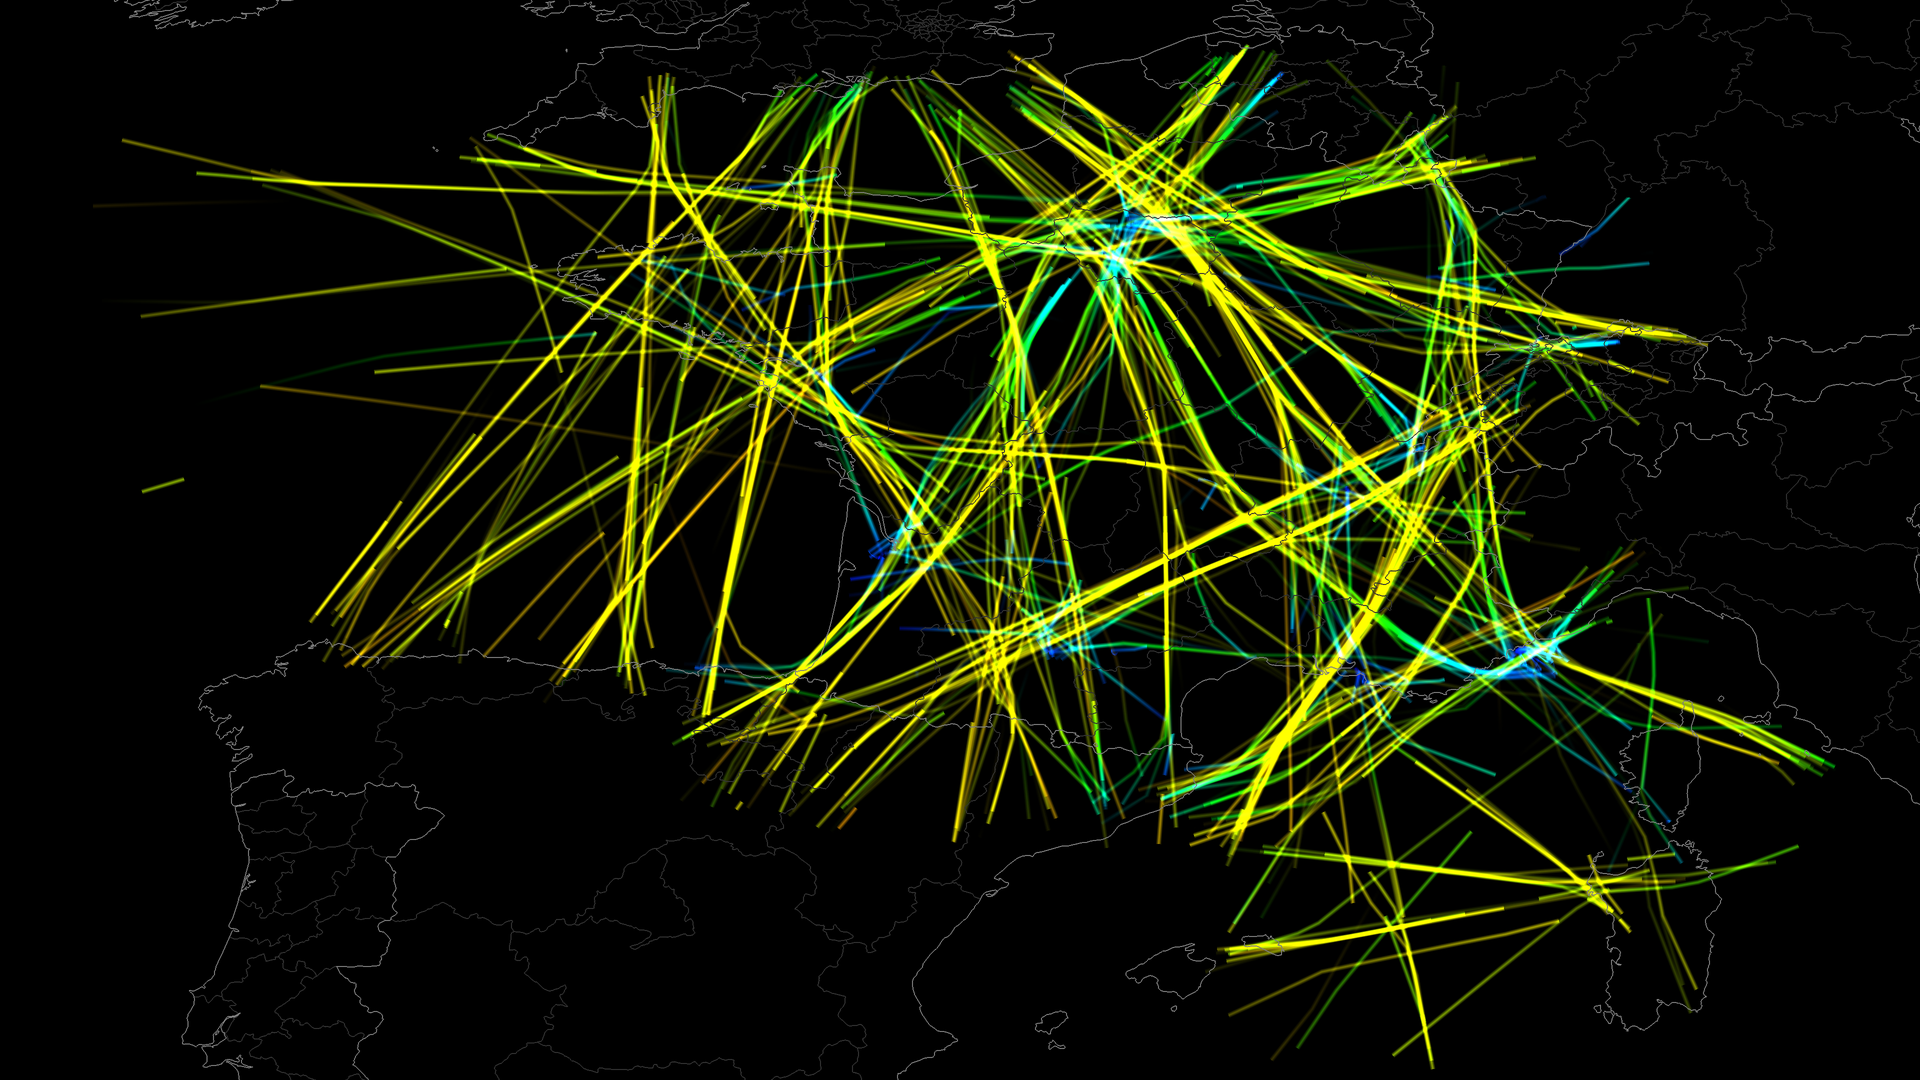
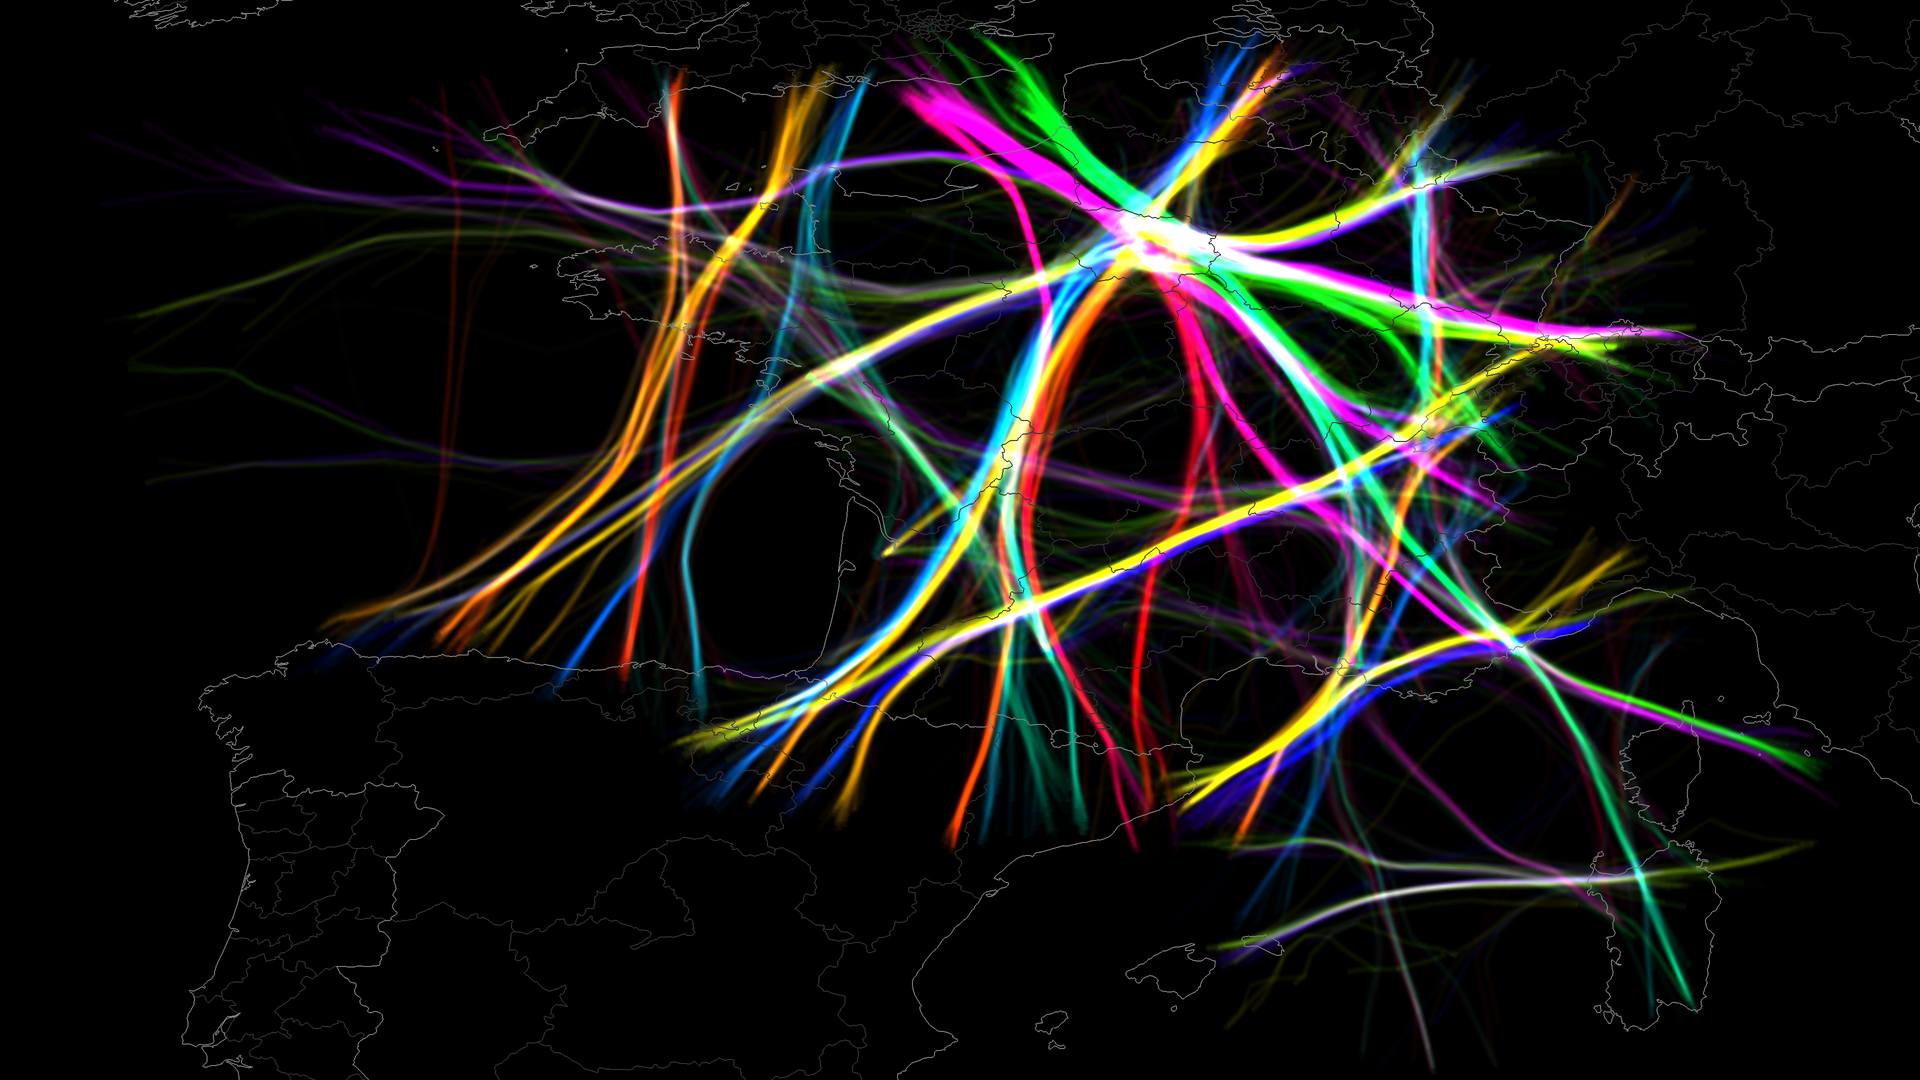
Bundling
We have applied the KDEEB bundling algorithm to our trails to further reduce visual clutter. Geographical information is lost, bundles now indicate connections between different airports rather than the actual flight paths.
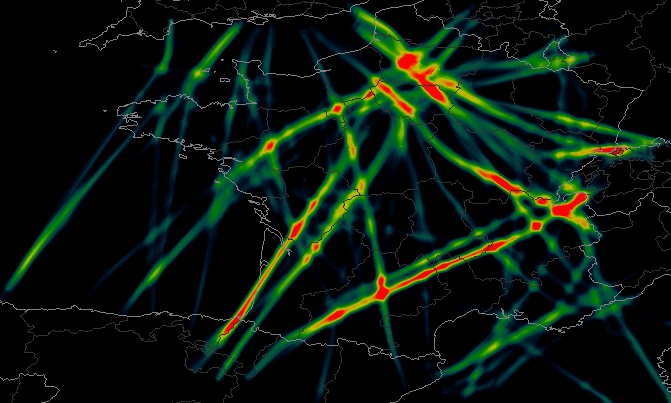
Congestion Detection
An important and frequently occurring task in movement data analysis is detecting and examining so-called congestion areas. We implemented a congestion map based on on a thresholded version of our density map.
Publications
Part of this work is described in our following publications:
- Dynamic Multiscale Visualization of Flight Data (T. Klein, M. van der Zwan, A. Telea), Proc. VISAPP, 2014.
- Bundled Visualization of Dynamic Graph and Trail Data (C. Hurter, O. Ersoy, S. Fabrikant, T. Klein, A. Telea), IEEE TVCG, 2013.