Test
The Moleview lens
Element-based plots
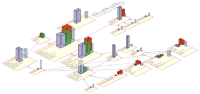
Consider the following visualizations
- scatterplots and multidimensional scaling plots
- node-link diagrams and bundled graphs
- color or grayscale images
These can be seen as element-based plots: They consist of many elements having 2D position and several attributes. Such large plots generate overdraw, which means it is hard to see, select, or brush, specific data elements
A new lens type
We implemented a new type of exploration lens, which combines features of existing semantic lenses, deformation techniques, attribute filters, and focus and context. The lens acts very much like a mole which moves earth around (the data) to unravel interesting things at specific locations (the focus).

The lens in use
The best way to understand how Moleview works and what it can do is to see the video available via this link.
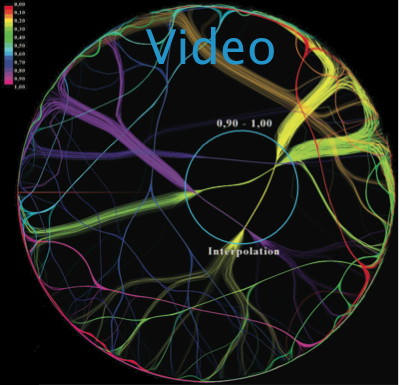
Note: If the video (WMV format) does not play in the browser, download it and play it locally.
Software
Coming soon
Publications
See the InfoVis 2011 paper available here.