Test
Fusing structure and dynamic information
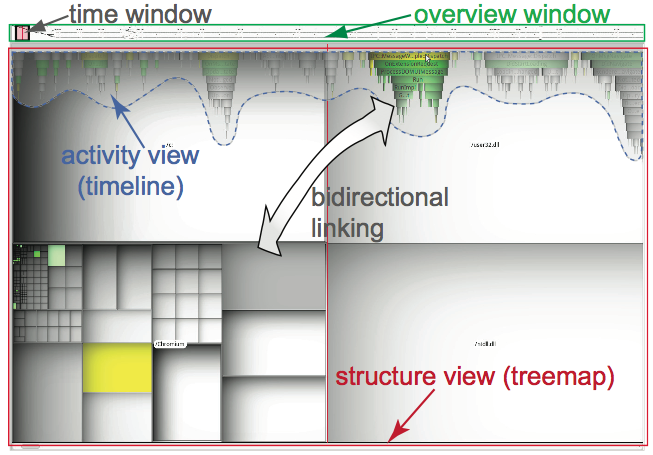
Visualization of data on software structure and related temporal activity supports the analysis of correlations between the two data types. This is typically done by linked views. This has shortcomings with respect to efficient space usage. Also, mapping the effect of user input in one view into the other view is difficult. We propose a novel, space-efficient technique that fuses the structure and activity spaces in one view.
We created ViewFusion, a prototype tool, for the understanding of program static structure and execution traces based on this technique.
Structure view
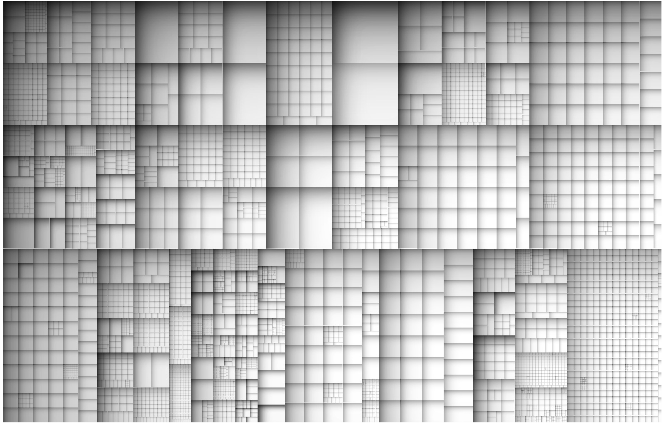
For structure data, we use a classical squarified cushion treemap. We propose a new implementation which approximates well the , and can be efficiently implemented using single-pass OpenGL 1.1 rendering. This yields real-time performance for hierarchies of (tens of) thousands of elements on consumer graphics cards. The snapshot below shows a treemap for a software hierarchy of 8850 elements.
Activity view
Dynamic data is given in our case by execution traces, which are sets of function calls (function ID, caller, and call start and end times). Such traces can contain (hundreds of) thousands of calls. We visualize traces using the classical icicle plot metaphor, augmented with cushion shading to emphasize execution structure. The view can be zoomed and panned interactively.
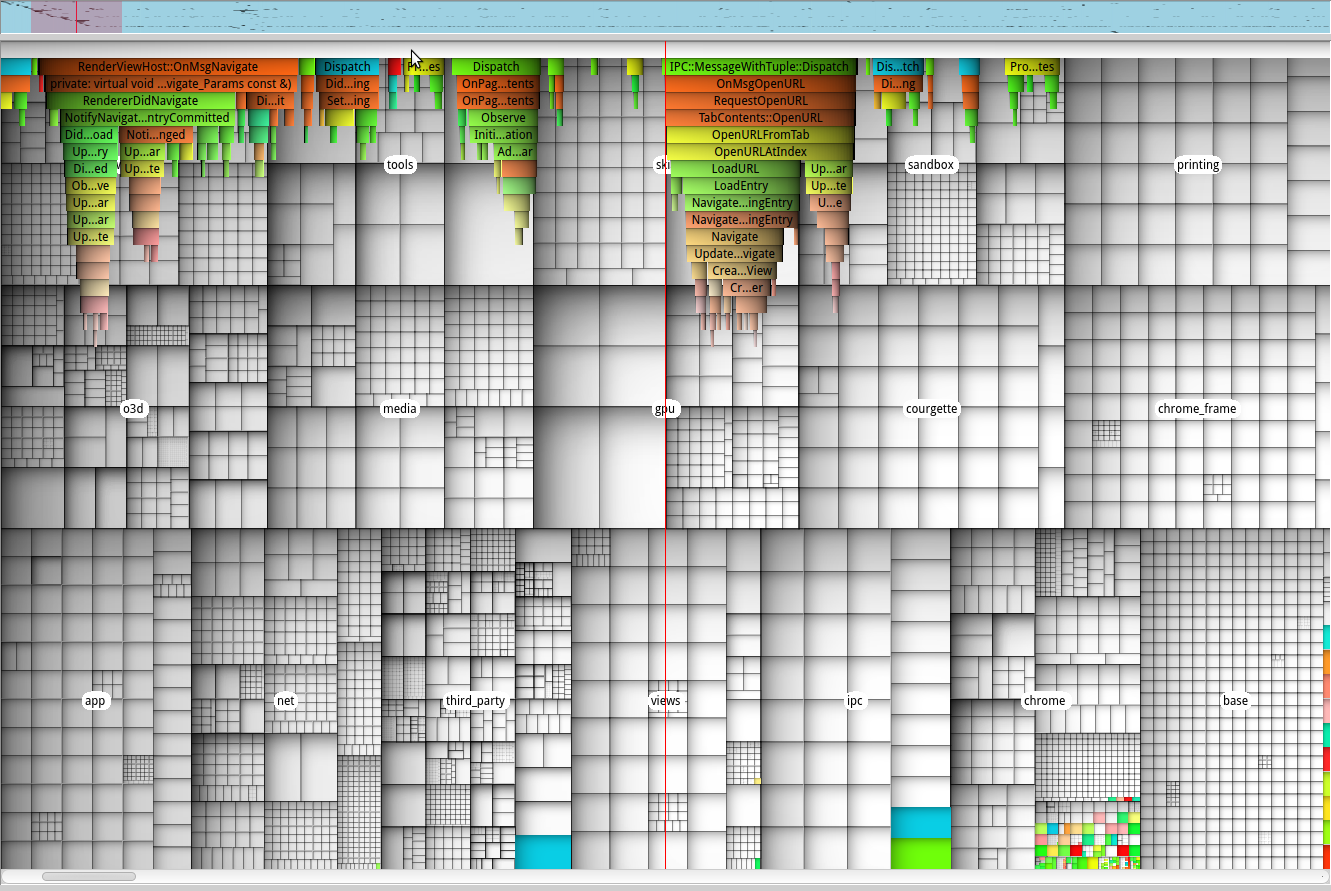
Interactive focus of interest
We next use shading linked to mouse interaction to convey the focus of interest and declutter the activity view.
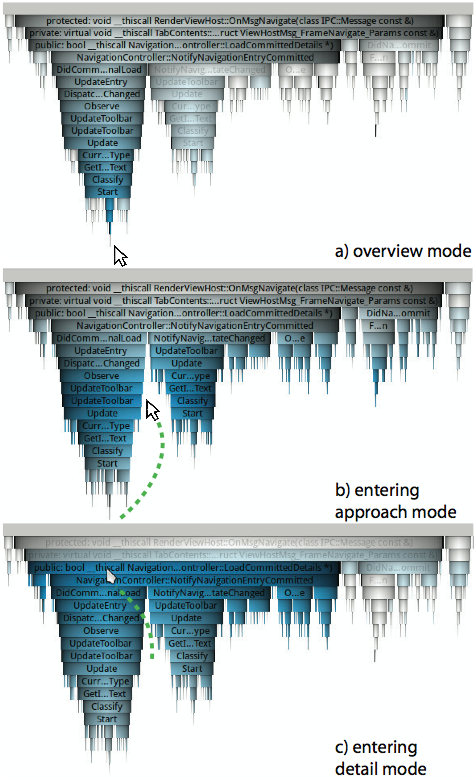
The image above shows the shading of the activity view as the mouse approaches this view. Three situations exist:
- overview: the mouse is below the activity view. We highlight the call-stack closest to the mouse
- approach: the mouse is between two call-stacks of the activity view. We highlights both these call-stacks
- detail: the mouse is inside a call-stack. We highlight this stack.
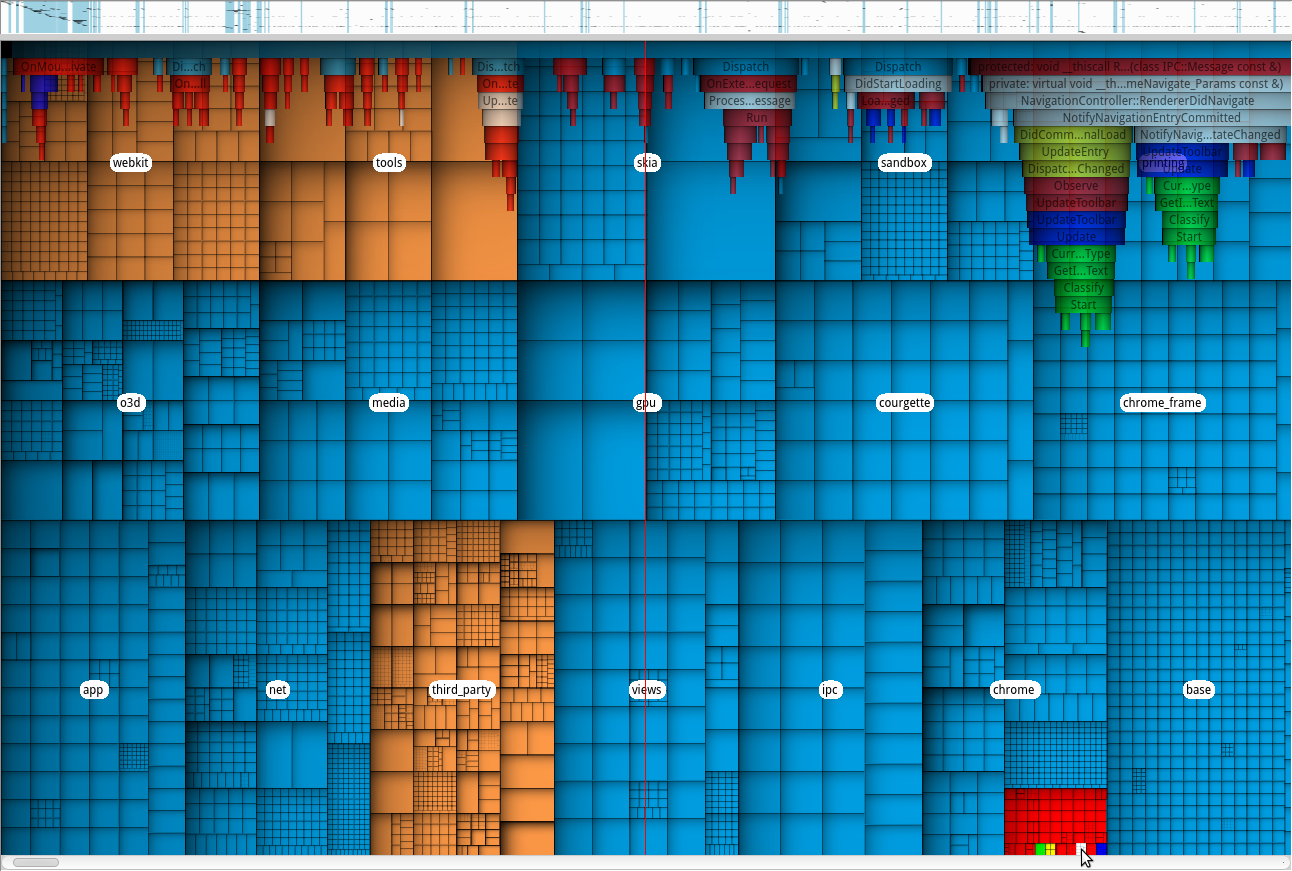
Interactive view linking
We also use interaction to link the activity and execution views. Simply put, when the user focuses on an element in a view, the corresponding (linked) element in the other view is automatically highlighted. This allows, for example, seeing
- where, in the structure, the functions called in a given stack are defined
- when, during the execution timeline, functions defined in a given subsystem are called
Elements in both views can also be colored by various metrics, such as package ID, call duration, call stack depth, number of callers/callees, and static quality metrics. This allows further correlating structural and activity information.
Applications
We recorded an execution of and analyzed it with our ViewFusion tool (8850 files and folders, 2.7 MLOC C/C++). The videos below illustrate this on a pre-filtered trace containing about 9000 calls to 920 function bodies (RuG link, HPI link).
Note: If the video (MP4 format) does not play in the browser, download it and play it locally.
You can also check out and comment on our work on YouTube!
<iframe width="420" height="315" src="http://www.youtube.com/embed/czhXPtt-Eoo" frameborder="0" allowfullscreen></iframe>
Publications
See publication 154 available here (RuG site) and here (HPI site)
Additional information
This work was done in collaboration with Jonas Trümper and prof. Jürgen Döllner (Computer Graphics Group, HPI, University of Potsdam, Germany).
For more details on ViewFusion, please contact its main developer and maintainer, Jonas Trümper.
See also the talk on multiscale visualization of A. Telea delivered at HPI, Potsdam, Germany, in Feb. 2012.