IMOVIS, Subproject 2: Visualization and Analysis of Diffusion Tensor Data
The goal of the project is to develop and improve visualization of large 3D datasets, in particular medical Diffusion Tensor data.
People
- Drs. Maarten Everts (PhD student)
- Dr. Andrei Jalba (collaborator)
- Dr. Henk Bekker (co-promotor)
- Dr. Tobias Isenberg (co-promotor)
- Prof. Dr. Jos B.T.M. Roerdink (promotor)
Recent results
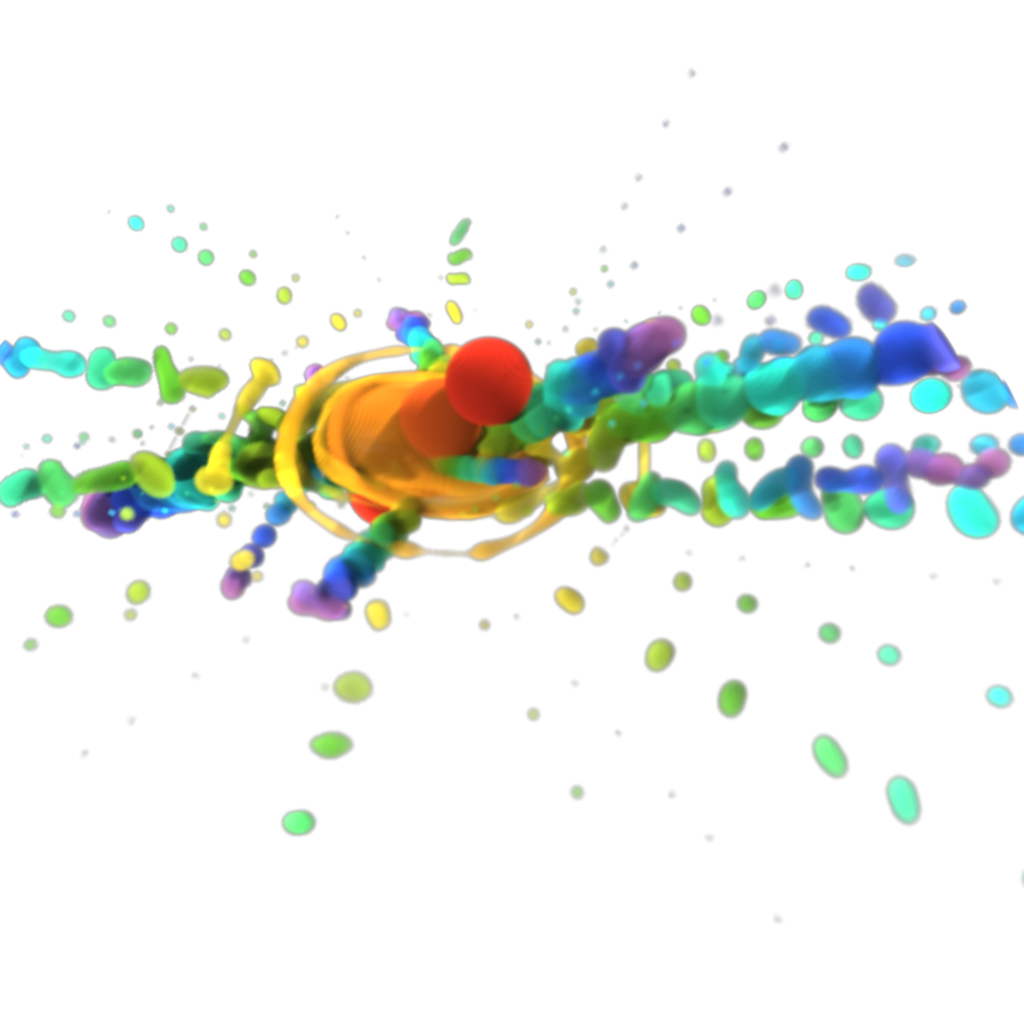
(:neo_flv-player Attach:NPR/Everts_2009_DDH Δ(.flv) width=560 height=315 startimage="/svcg/uploads/NPR/Everts_2009_DDH.jpg" -link:)
Example of non-photorealistic visualization: using depth-dependent line halos to create interactive and animated illustrative visualizations of dense line data such as DTI fiber tracts or particle traces from fluid simulations.
(:neo_flv-player Attach:NPR/Svetachov_2010_DCI Δ(.flv) width=560 height=315 startimage="/svcg/uploads/NPR/Svetachov_2010_DCI.jpg" -link:)
The additional illustrative visualization of the surface of the brain and skull adds context to DTI fiber tract depictions.
![]()
Funding
Netherlands Organization for Scientific Research (NWO). This project is part of NWO's VIEW Program: Visual Interactive Effective Worlds, theme Interactive Data Visualization (project 643.100.501).
Collaboration
The Visualisation and Interactive Systems Institute, University of Stuttgart (headed by Professor Thomas Ertl).
Publications
bibtexquery:[BibTeX.BibTeX][$this->entryname=='Svetachov:2010:DCI'][][] bibtexquery:[BibTeX.BibTeX][$this->entryname=='Everts:2009:VWM'][][] bibtexquery:[BibTeX.BibTeX][$this->entryname=='Everts:2009:IRo'][][] bibtexquery:[BibTeX.BibTeX][$this->entryname=='Everts:2009:DDH'][][] bibtexquery:[BibTeX.BibTeX][$this->entryname=='Everts:2008:GAf'][][] bibtexquery:[BibTeX.BibTeX][$this->entryname=='Everts:2007:PBI'][][] bibtexquery:[BibTeX.BibTeX][$this->entryname=='Everts:2007:PBa'][][]