
Research
We conduct research in the following major areas. Please make a selection from the menu below to learn more about research in any of these areas. We also maintain an overview of externally funded projects. A poster with an overview of our work is also available.
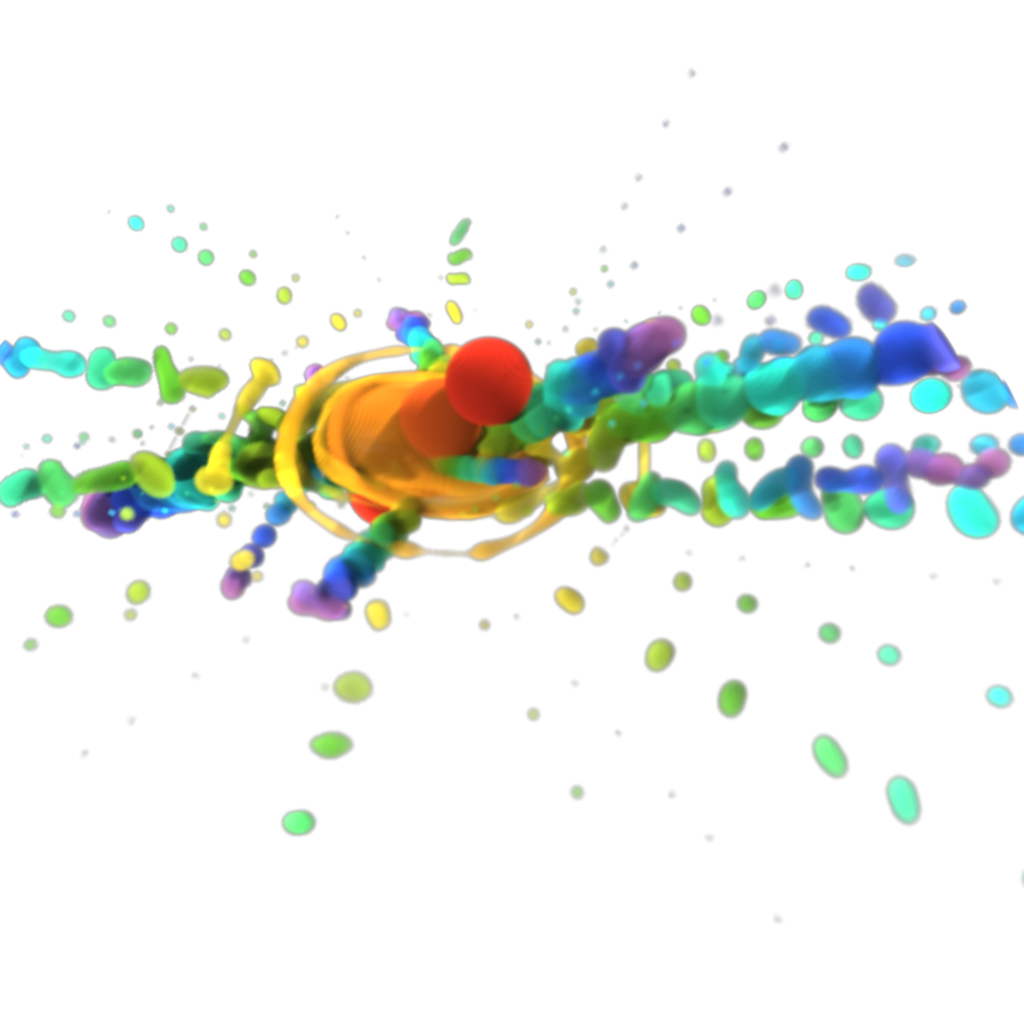
| Scientific Visualization Within scientific visualization, we explore techniques, methodologies and design procedures to visually represent, filter and navigate complex scientific data from multiple domains. Our research in this area addresses challenges such as the handling of large data sets, the visual filtering of multifield data, the employment of machine learning for augmenting data analysis and visual mapping, and the design of entangled interaction with its visual representation. The research merits in novel techniques as well as modern design patterns for still- and interactive visualizations. Those research results are subsequently valorized via their domain-specific application in the medical sciences, astronomy, the geo- and environmental sciences. Our specializations are High Performance Visualization, Visualization of Multifield Data, Geoscientific Visualization, and Visualization Design. | |
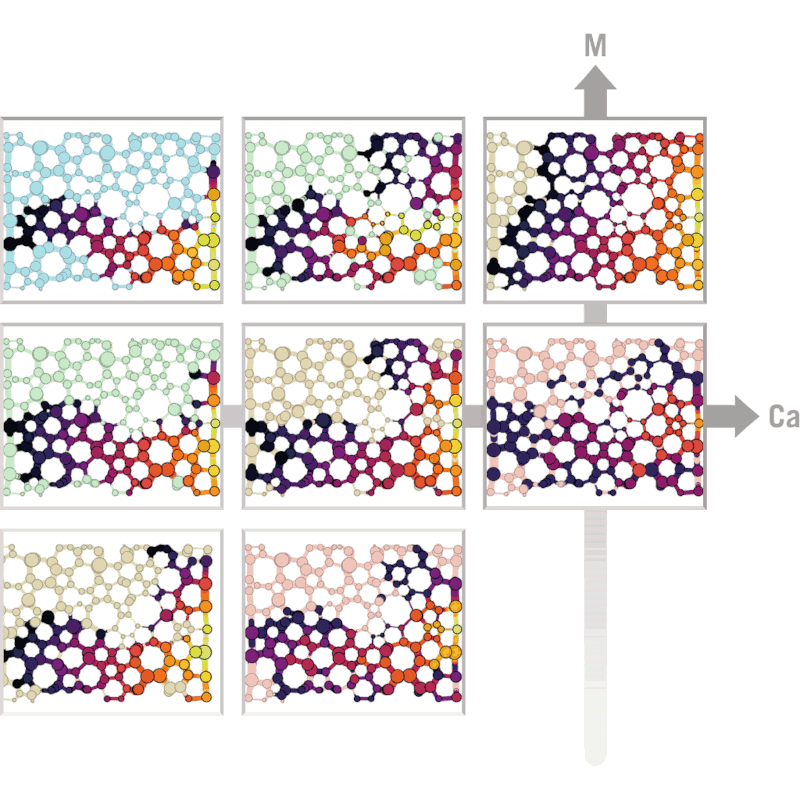
| Information Visualization Information visualization is used to represent abstract data (such as file system hierarchies, web site or database contents, telecommunication or biological networks, etc.) in a visual way using good visual metaphors and efficient interaction techniques. In our research we focus on the combination of scientific and information visualization techniques in various areas, such as visualization of biological networks or software visualization. | |
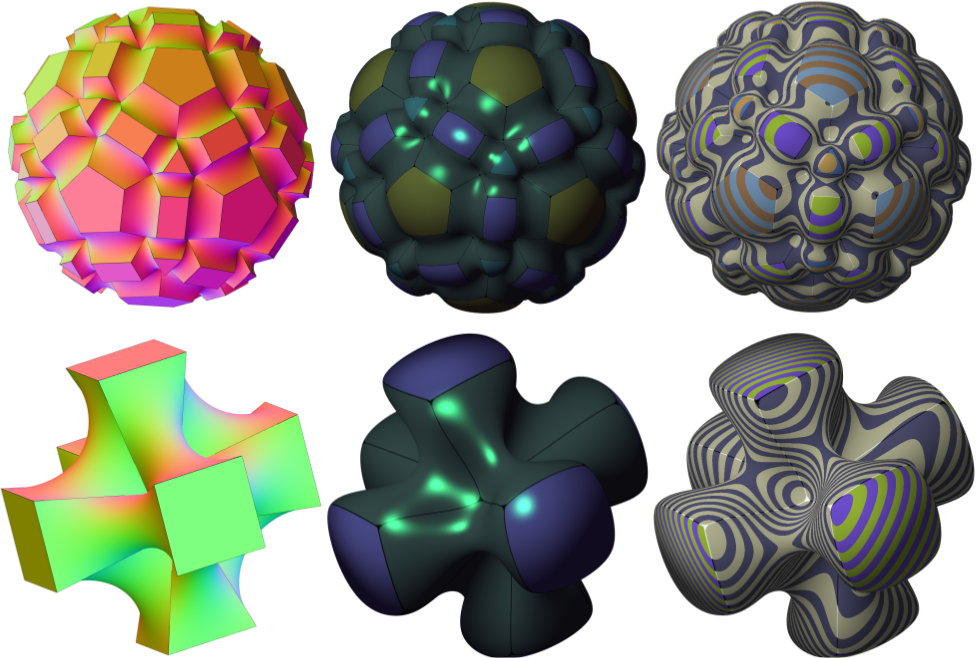
| Geometric Modelling Shape representation is a key ingredient in many research areas and applications, such as Computer Aided Design (CAD), Computer Graphics, but also Finite Elements (FEM) and Isogeometric Analysis (IgA). We focus mainly on representations of (smooth) surfaces of arbitrary manifold topology and on (locally) refinable structures based on splines and/or subdivision, and their use in various application areas. We also investigate methods for converting input meshes into smooth surfaces which can be efficiently rendered on modern GPUs. | |
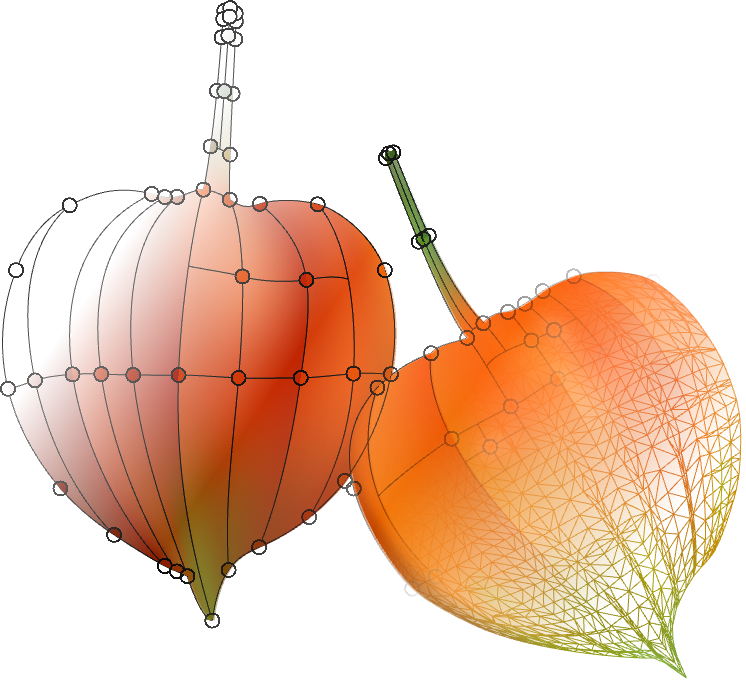
| Vector Graphics Vector graphics, as opposed to raster graphics, represent digital images in a scalable and resolution independent manner, and are based on so-called primitives. These primitives range from simple ones such as lines, circles, disks, and rectangles, to more complicated ones like diffusion curves. We focus on the gradient mesh primitive, available e.g. in Adobe Illustrator and Inkscape, and its extensions, including (gradient) meshes of arbitrary manifold topology, sharp transitions, and local refinement. | |
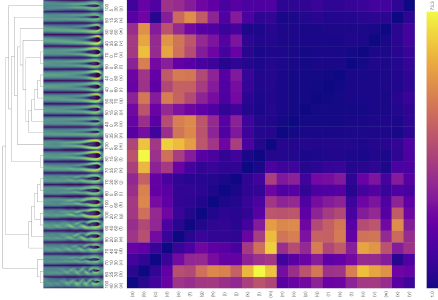
| Optimization and Machine Learning for Visualization Optimization and machine learning can address various visualization problems in a data-driven way. Our research uses such techniques to analyze data, identify informative visual mappings, and dynamically adapting visualization systems at runtime. | |
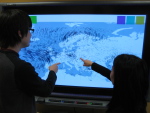
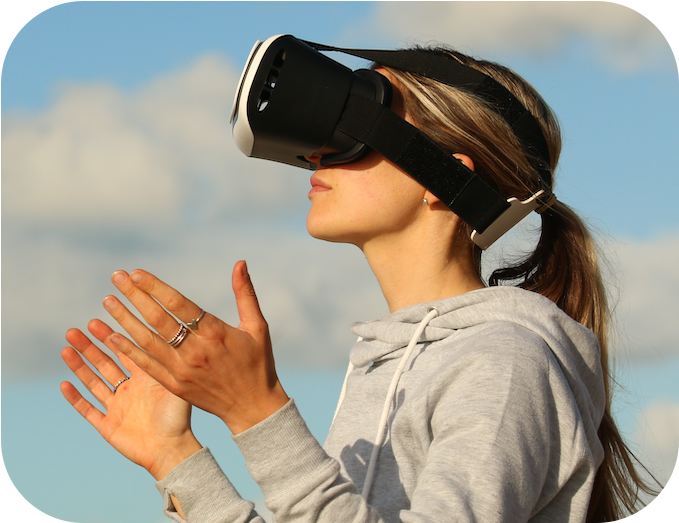
| Interactive Computer Graphics & Visualization We investigate techniques and design principles for the intuitive interaction with rendered images and visualizations. The research is driven by potentials and constraints on modern display technologies: large, touch-sensitive displays are included here equally well as mixed-reality devices and mobile smart-devices. Such direct interaction allows users to be creative, engage and communicate visual information, and facilitate this via a barrier-free interface. Conversely, we deduce adaptation strategies for graphics generation and visualization to user-specific needs. | |
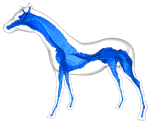
| Multiscale Shape Processing Multiscale shape processing involves 2D and 3D shape segmentation, denoising, edge and feature detection, simplification, and matching done on several levels of detail. These operations can be effectively and efficiently supported by several classes of methods, such as skeletonization (or medial axis) computation, level sets, and partial differential equations. | |
| Visual Perception Visual perception is the study of how our eyes and brain process visual stimuli to create meaningful interpretations of the world around us. Humans are the main observers of the content produced by image processing, computer vision, and computer graphics techniques. Hence, visual perception principles are instrumental in optimizing the visual content according to the properties and limitations of the Human Visual System (HVS) for the best user experience with our limited computational and display hardware resources. |