Visualization of Multifield Data
headed by Dr. Steffen Frey
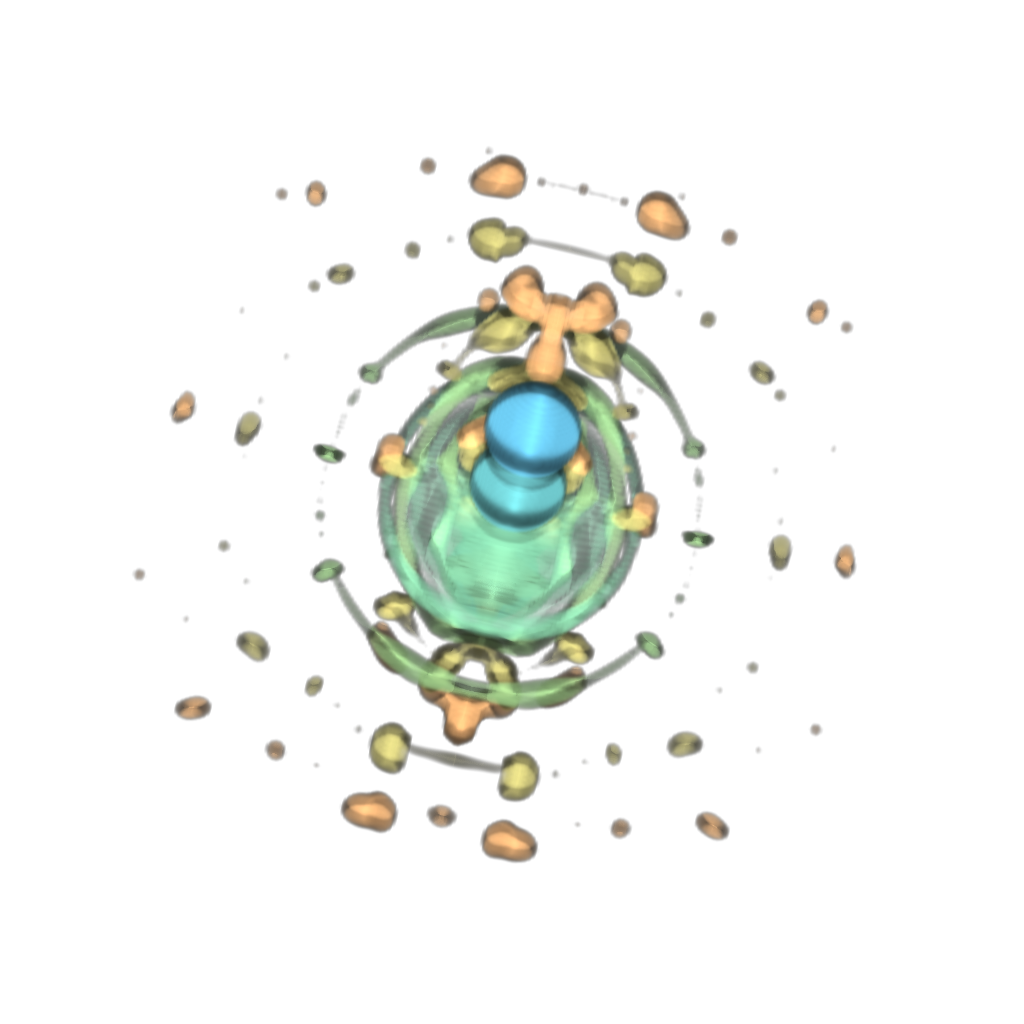
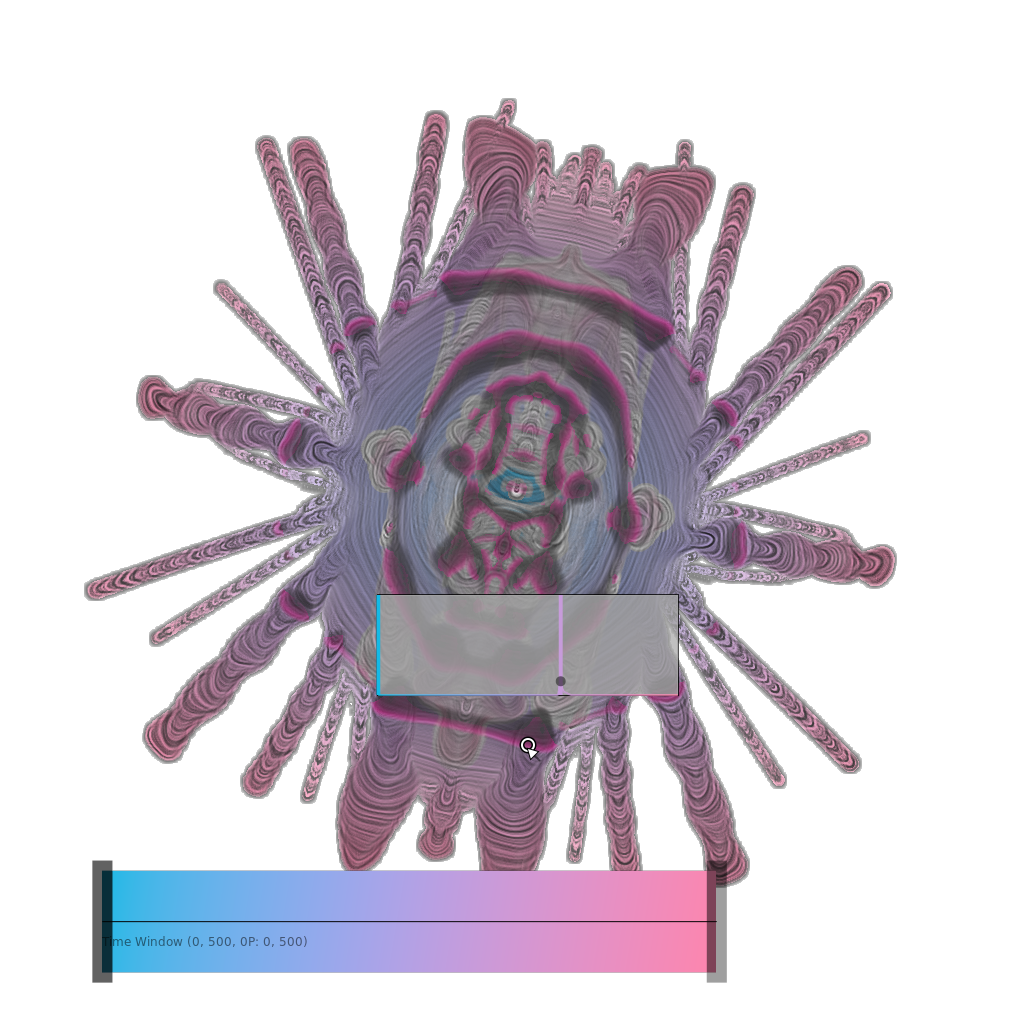
The analysis of multiple fields reflecting changes in time, simulation or experiment configuration, variables, etc. is demanding for various reasons. Besides potential performance issues, a major challenge is to provide the user with a comprehensive overview as a basis for further exploration. Static representations incorporating both spatial and temporal aspects can be very effective for this. However, to avoid visual overload and clutter, some form of data reduction is required, for instance in time (selecting representative time steps) or in space (only considering object contours). This reduced data can then be shown to the user in aggregated form.
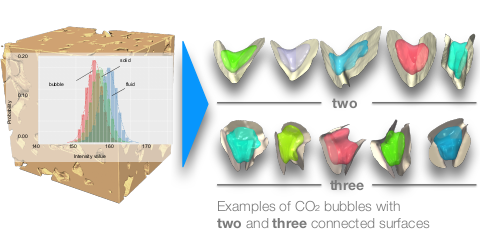
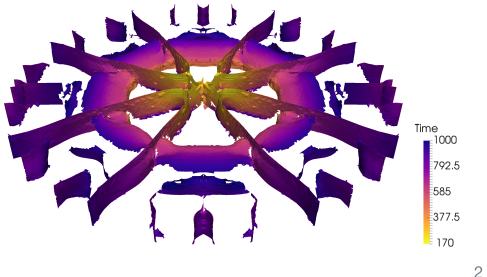
Beyond generic techniques, also dedicated visual representations are developed in close collaboration with scientists from other domains. They are designed specifically to address research questions in the respective field on the basis of conducted experiments and/or simulations. For instance, dedicated representations have been developed to support the understanding of complex fracture processes, CO2 bubble storage in sand stone, and two-phase flow displacement in porous media.