Image-based information visualization
Information visualization, or InfoVis, creates efficient and effective representations for the visual analysis of large amounts of non-spatial data such as graphs, tables, networks, text, and software.
Most InfoVis visual representations (e.g. node-link diagrams, scatterplots, parallel coordinates, treemaps, and table lenses) are discrete: They consist of a clearly separated set of graphical primitives. Such representations work well for moderate-scale datasets, but have a fundamental problem when images get crowded: They create the impression of clutter.
Images as first-class citizens
Substantial knowledge exists both for synthesis and analysis of images in classical image processing and computer graphics. We aim to (re)use this knowledge for creating easier to understand, more natural, and more scalable InfoVis metaphors. This research is based on several key principles:
- we treat images as continuous fields; this allows us to analyze and characterize them in various ways (e.g. segmentation, filtering, contrast enhancement)
- we treat images as multiscale fields; this allows us to handle large amounts of data at a user-specified level of detail
- we strive to create natural images resembling smooth, shaded, shapes; such images are arguably easier to perceive than high-frequency, discrete imagery
Several ongoing projects in this area are outlined below.
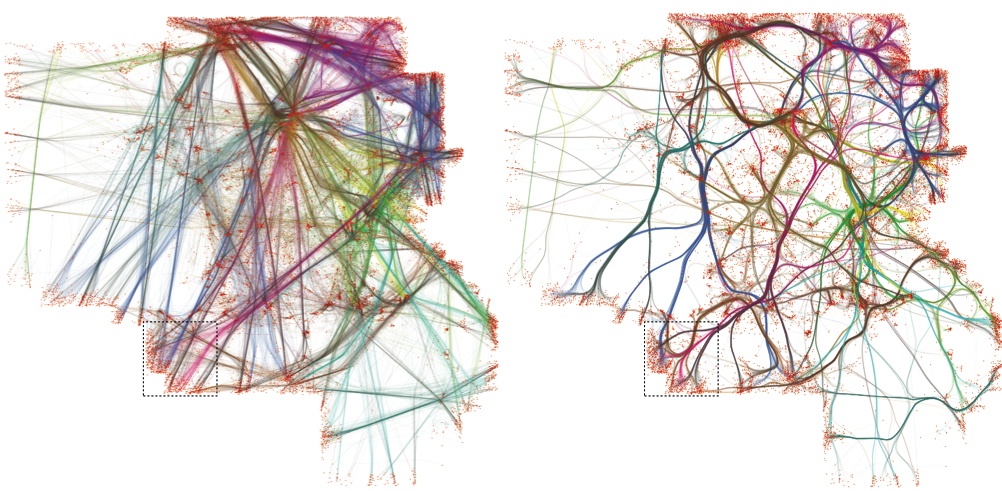
Project 1: Image-based edge bundles
We visualize large bundled-edge graphs using smooth pseudo-shaded shapes which convert a node-link layout to a continuous luminance field.
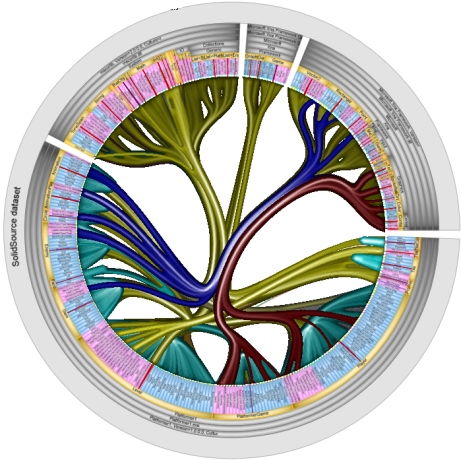
Project 2: Skeleton-based graph bundling
We create bundled-edge layouts for arbitrary graphs using 2D shape skeletons. This method converts the entire graph layout problem into an image processing problem.
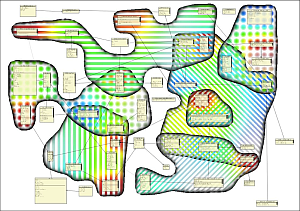
Project 3: Areas of interest
We create areas of interest on UML-like system diagrams to convey subsets and related metrics using 2D distance and feature transforms. This method converts the attributed-set viualization problem to a level-set problem.