Chapter 6: Vector Visualization
Sample programs
Fast 2D fluid flow simulation
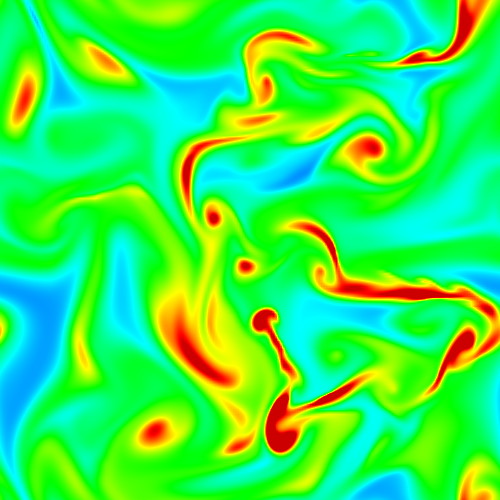
This sample implements a simple real-time simulation of fluid flow in a 2D box. The sample is based on the Navier-Stokes solver proposed by Jos Stam (see reference). In the graphics window, click and drag the mouse to stir the fluid and also inject matter into it. This creates complex swirling patterns. The fluid density is visualized using color mapping.
Modify this sample to use any of the scalar or vector visualization methods discussed in Chapter 5 and Chapter 6 to visualize this time-dependent field!
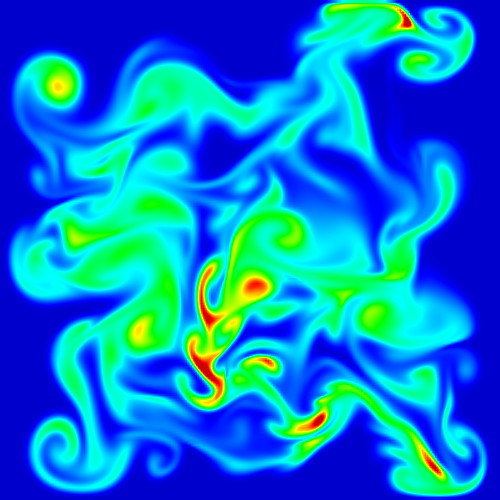
Even faster 2D fluid flow simulation
This sample implements a real-time simulation of fluid flow in a 2D box. The sample is based on the Navier-Stokes solver using the Fast Fourier Transform (FFT) proposed by Jos Stam (see reference). This sample works precisely as the previous one: Click and drag the mouse to stir the fluid and also inject matter into it. The fluid density is visualized using color mapping. In contrast to the previous sample, this FFT-based fluid simulation
- works much faster, and thus allows creating more complex time-dependent flow patterns by using larger grid resolutions
- uses periodic boundary conditions as opposed to the no-slip boundary conditions of the first sample
Modify this sample to use any of the scalar or vector visualization methods discussed in Chapter 5 and Chapter 6 to visualize this time-dependent field!
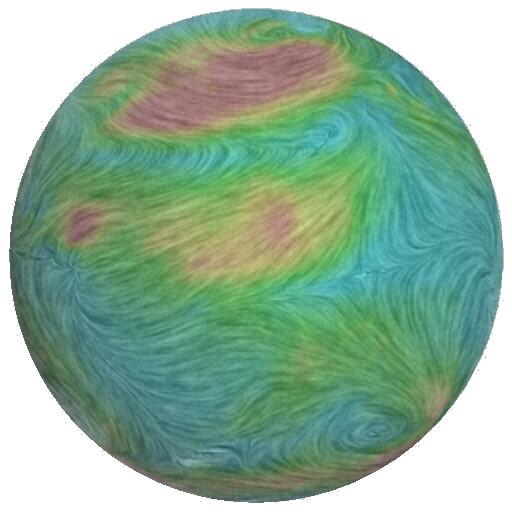
2D fluid flow simulation (FFT)
2D vector glyphs
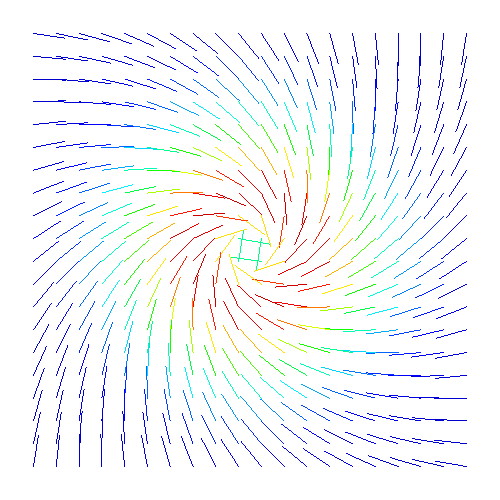
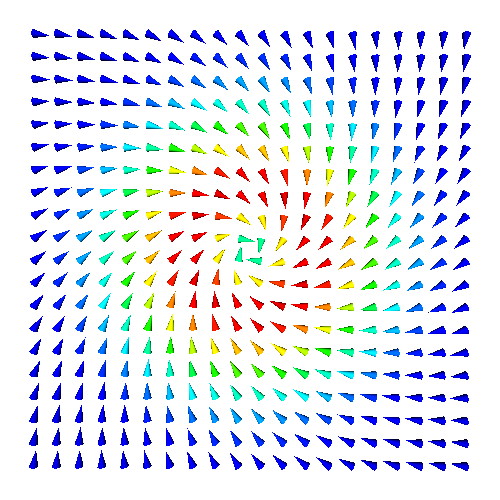
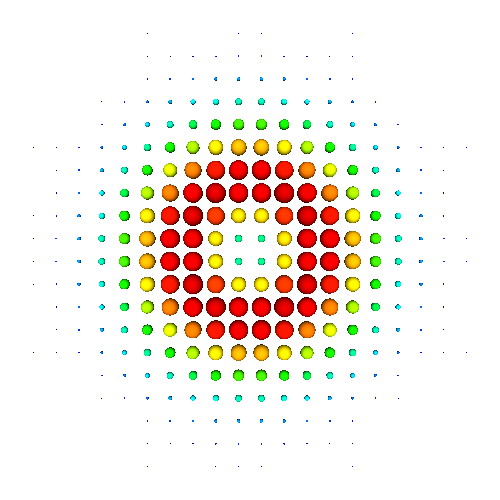
This sample demonstrates the usage of vector glyphs for the visualization of 2D vector fields. Line, cone, point, and ball glyphs are used. Glyphs can be scaled and/or colored to reflect the vector field magnitude. The sample also demonstrates how to compute the gradient of a 2D scalar field. Try this sample by defining your own 2D vector fields!
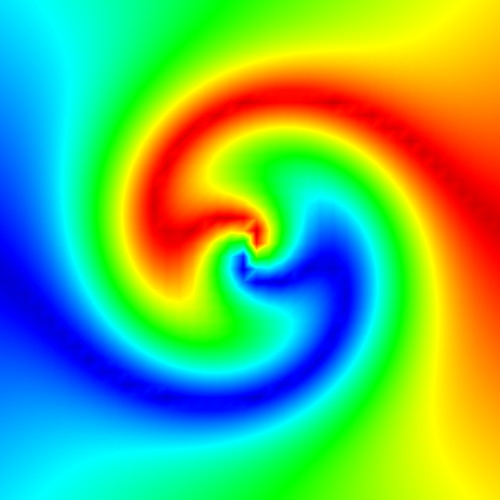
Directional color coding
These samples demonstrate the usage of directional color-coding to visualize 2D vector fields. The first sample shows a simple solution: Encode the vectors' directions as a scalar field, and next use scalar color-mapping. Some direction ambiguities are present. The second sample demonstrates the better solution: Convert each vector direction to a hue, and next use interpolation in color space. This also demonstrates HSV to RGB color conversion. Try to modify the samples to encode vector magnitude as e.g. saturation. Also, modify the second sample to use the high-quality texture-based color interpolation demonstrated for Chapter 5!

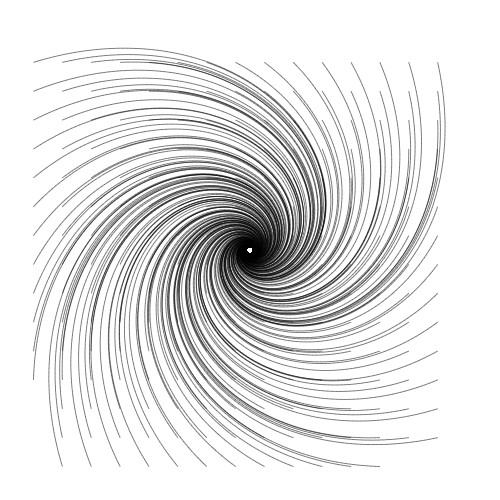
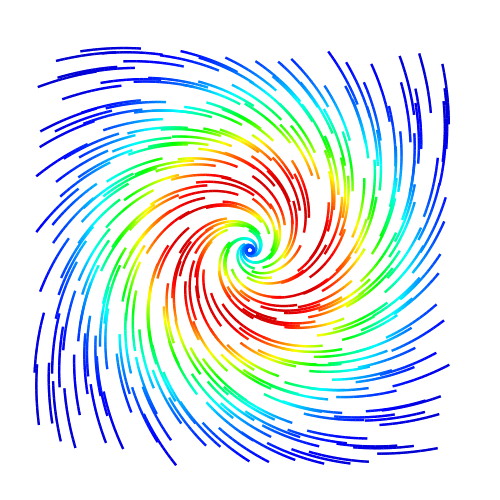
2D streamlines
This sample demonstrates the construction of 2D streamlines visualization of 2D vector fields. Several rendering styles are shown (points, lines, magnitude-colored lines, and tapered arrows). The code allows controlling the streamline seeding, stopping criteria, sampling density, and streamline length. The code also demonstrates how to bilinearly interpolate 2D vector fields on uniform grids. Modify this to achieve other rendering styles, such as variable-thickness streamlines, or visualize other vector fields!
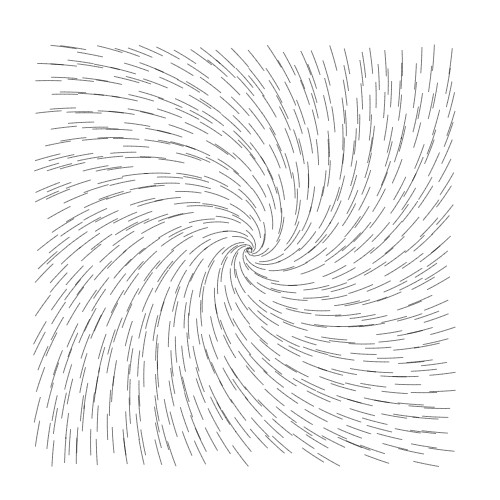
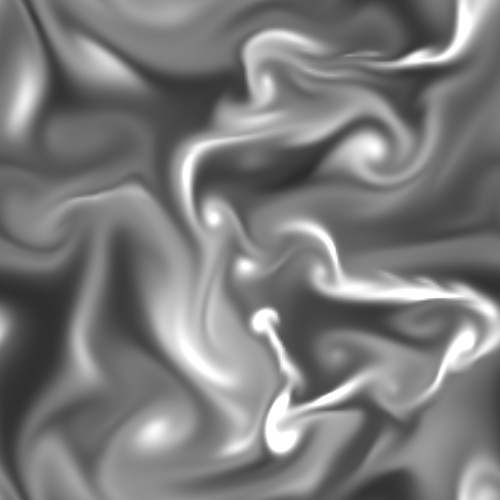
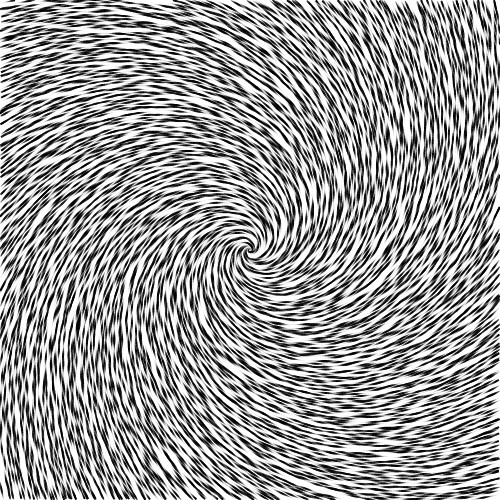
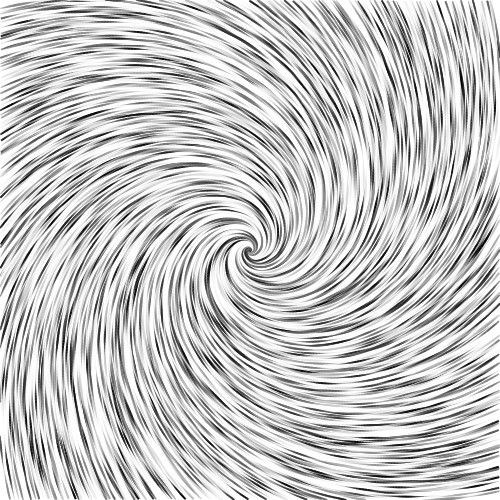
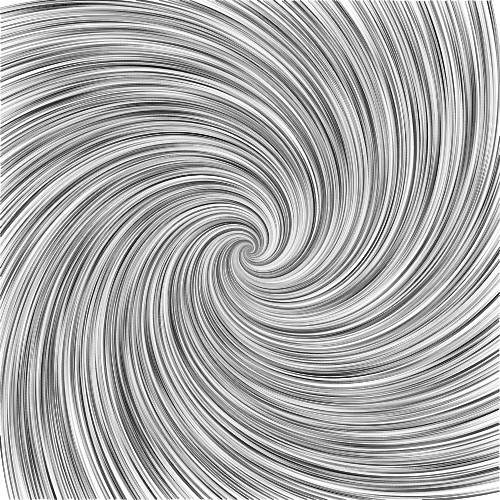
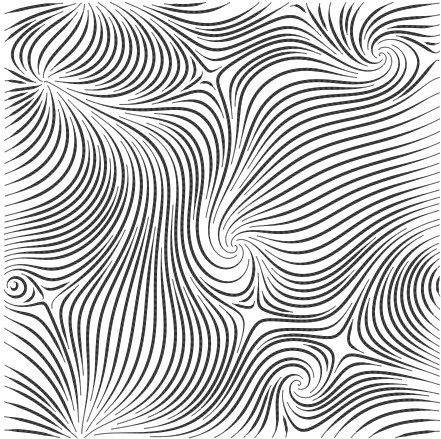
Dense streamlines
This sample demonstrates the creation of a LIC-like visualisation for 2D vector fields. The visualisation is constructed by blending together a set of densely-seeded streamlines, which are rendered as tapered shapes.
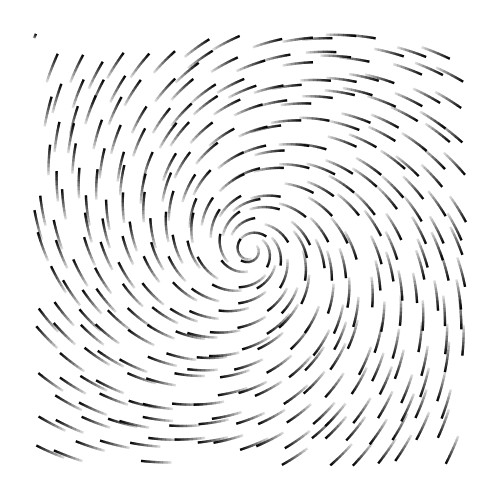
Uniform 2D streamline seeding
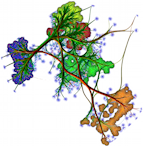
This sample demonstrates the method of Mebarki et al. for farthest point streamline seeding that generates an uniform coverage of a 2D domain with streamlines (Proc. IEEE Visualization 2005). The sample code (Windows executable only) illustrates well the working and quality of the algorithm. Own datasets can be easily created and tested with the code.
Streamline seeding demo (cached copy)
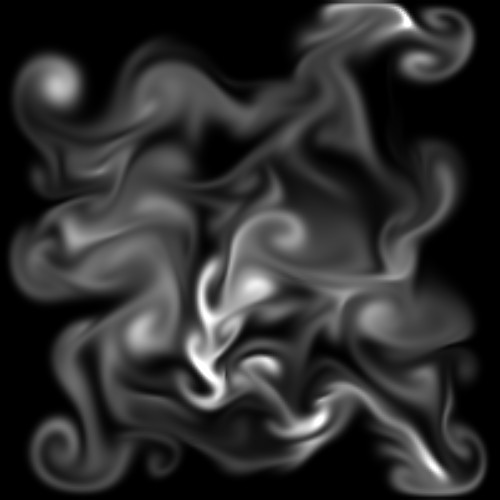
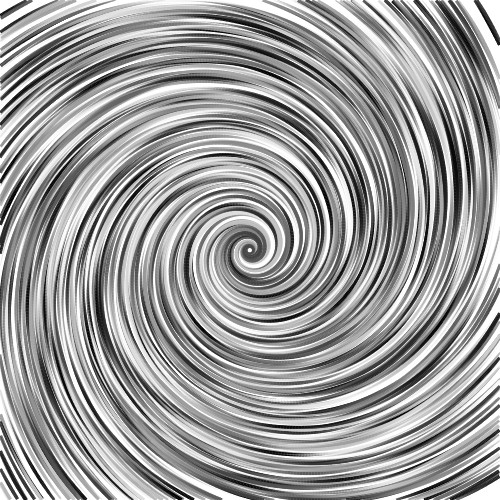
2D Image based flow visualization
This sample demonstrates the method of Van Wijk for image-based flow visualization (IBFV, Proc. ACM SIGGRAPH 2002). The sample code shows how IBFV can generate high-resolution patterns encoding the direction and magnitude of two time-dependent flow fields, encoded on a 2D uniform grid. Try your own vector field! The sample is also a good starting point to experiment with various options (different luminance textures, vector magnitude color mapping, and implementing IBFV on 2D unstructured grids).
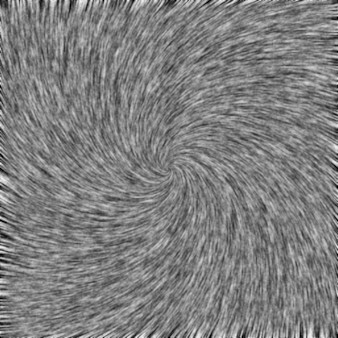
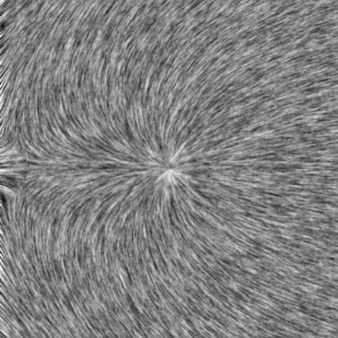
Image based flow visualization for 3D surfaces
This sample demonstrates the image-based method of Van Wijk for visualizing flows or 3D vector fields constrained to 3D surfaces (Proc. IEEE Visualization 2003). The sample code (Windows executable only) illustrates well the working and quality of the algorithm, and allows tuning all algorithm parameters via its user interface. Own datasets can be easily created and tested with the code.
3D IBFV surfaces demo (cached copy)
Depth-dependent halos
This sample demonstrates the depth dependent halo (DDH) method of Everts et al. (IEEE Visualization 2009). The demo (Windows, OS X, and Linux) accepts as input a dense set of 3D curves, e.g. streamlines traced in a 3D vector field, or a dense 3D point cloud e.g. such as obtained by surface scanning (Chapter 8). The user can interactively change the DDH parameters and see the obtained results.
DDH demo (cached copy)
