Multiscale Data and Shape Analysis
headed by Prof. Dr. Alexandru C. Telea
Shapes come in a variety of flavors: 2D images or countours, 3D surfaces or volumes, and can also carry data attributes, such as normals, textures, vectors, scalars, or tensors. Multiscale shape processing refers to a wide class of operations performed on such shapes at different levels-of-detail. Shape processing operations which relate to currently active research topics includes
- feature-preserving smoothing: eliminating the small-scale details of a shape (e.g. noise) while keeping its sailent features (e.g. edges)
- shape classification: partitioning a shape into regions having different properties, e.g. corners, edges, convex, concave, and flat regions
- shape segmentation: decomposing a shape into regions perceived as its different parts, e.g. finding the limbs, torso and head of a human silhouette
- shape matching: given two or more shape, find their similar components
- shape simplification: given a shape, produce a simpler shape (e.g. less polygons) which looks similar
Data from measurements or scientific simulations also comes in many flavors: multivariate tables, graphs, having quantitative, ordinal, categorical, or relational values. Multiscale data processing refers to operations performed to represent, analyze, and understand such data at different level-of-detail. Example operations in this area include
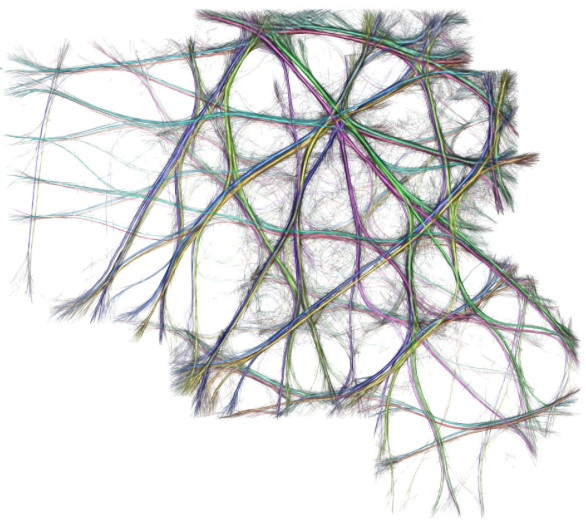
- graph analysis: given a large and complex graph, produce a simplified view thereof that highlights the main patterns;
- multidimensional analysis: given a table-like dataset having thousands of points, each with hundreds of dimensions (or more), identify and depict the main correlations, outliers, groups, trends in the data;
To address these goals, we use several classes of techniques:
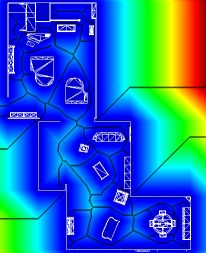
- image-based techniques: represent, process, and interact with the data in terms of (continuous) images, thereby leveraging many existing image-processing techniques to assist complex data-centric tasks;
- multidimensional projections: given a high-dimensional dataset, construct a low-dimensional (2D or 3D) representation thereof that allows users to spot patterns of interest easily and reliably;
- graph bundling: given a large relational dataset, construct a visually simple 2D embedding thereof which emphasizes main connectivity and/or data-related patterns between groups of related nodes;
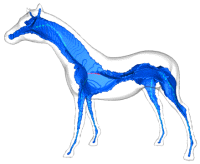
- skeletonization: computing the so-called skeleton, or medial axis, a thin structure centered within a 2D or 3D shape;
- partial differential equations: represent the shape modification as a differential operator, and the processing as the operator's application.
Follow the sidebar links to find more information!