Test
Color Tunneling: Interactive Exploration and Selection in Volumetric Datasets
Consider a large 2D (image) or 3D (volume) dataset, where each element has one or several data attributes. In many use-cases, we want to select a specific subset of elements, e.g. pixels or voxels representing a specific 2D or 3D shape, such as an object in an image or an anatomical structure in a volumetric scan.
This operation is hard, since
- describing what makes elements belong to a selection may be a complex function of position and data values;
- interesting data elements may be (spatially) mixed with non-interesting ones;
- in 3D volumes, occlusion complicates the selection process considerably.
Color Tunneling
We have developed an interactive and easy-to-use mechanism to assist the above selection process. Essentially, our solution is based on the following tools:
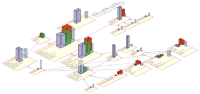
- linked views: show different views of the same data (spatial, scatterplots, histograms);
- animation: smoothly morph data between views, allowing users to see or (de)select data in the best fitting view;
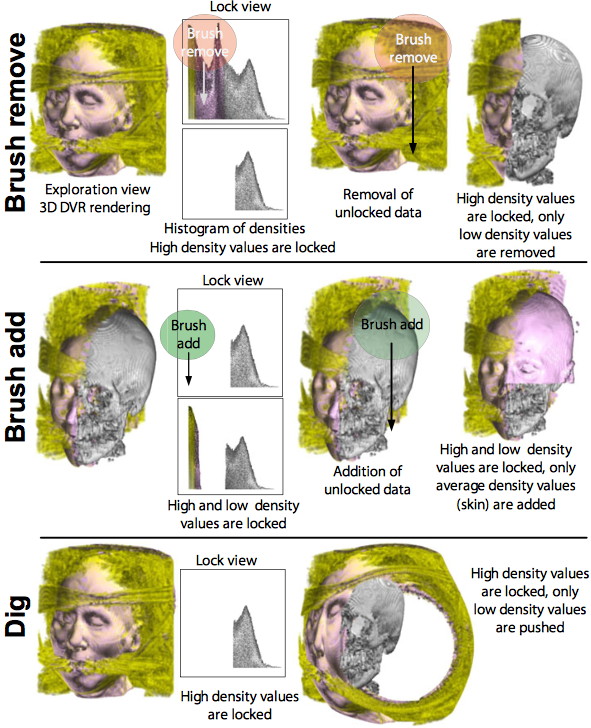
- lock tool: selects data of interest to be kept in focus;
- dig tool: smoothly pushes away unlocked data to reveal interesting items;
- erase tool: removes data from selection in any view.
The image below shows these different tools in action on a 3D CT scan.
Applications
Color tunneling was applied to many different use-cases and types of datasets. Sample applications are presented below.
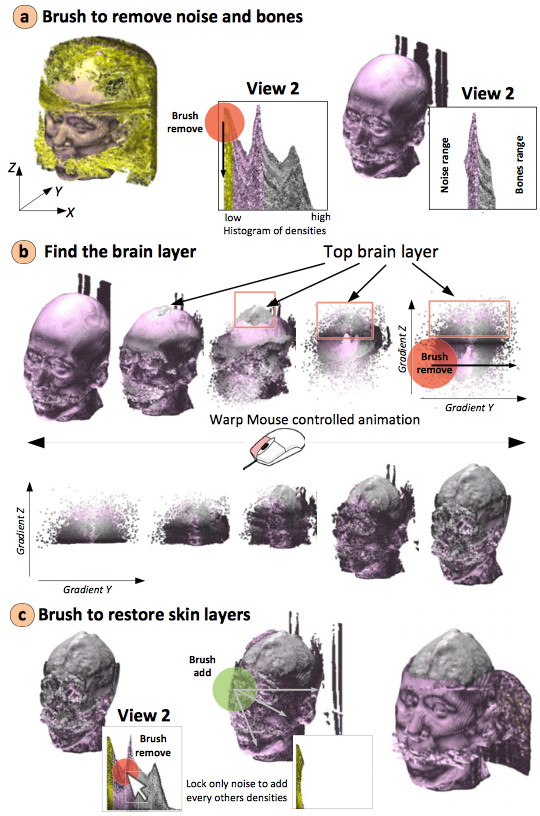
Medical imaging: Expose brain top part
Given a CT scan, we want to expose the top part of the brain. For this, we have to remove the soft skin tissue (but keep the similarly soft brain tissue) in the top area; and keep all tissues in the bottom area. This is done using Color Tunneling by three simple interactive operations involving the 3D scan and its tissue-gradient 2D histogram, as shown in the image below.
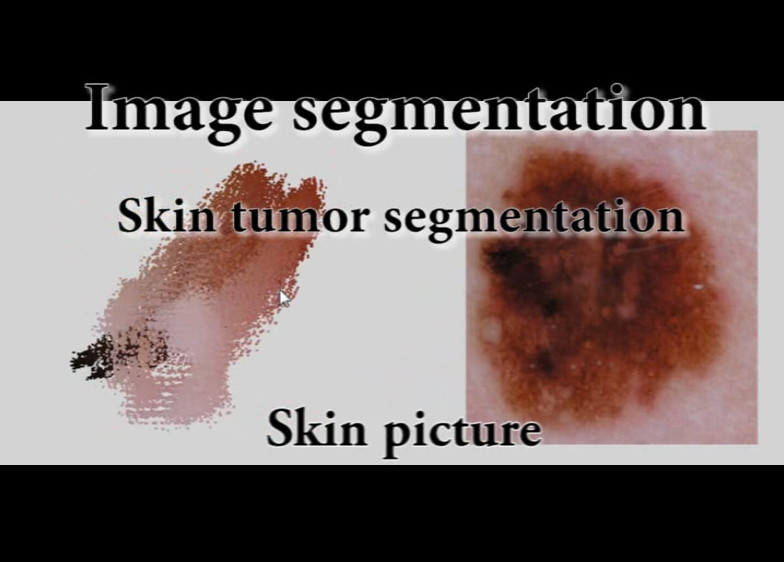
Medical imaging: Skin tumor segmentation
Given a 2D skin image, we want to accurately segment the inner, respective outer, structures of a skin mole surrounded by healthy skin. This is done using Color Tunneling by five simple interactive operations involving the 2D image and its brightness-gradient and saturation-hue scatterplots, as shown in the image below.

Video
The best way to understand how Color Tunneling works and what it can do is to see the video available via this link.
Note: If the video (WMV format) does not play in the browser, download it and play it locally.
Implementation
Color Tunneling is implemented using programmable OpenGL to yield real-time animations and interactive manipulations of 2D and 3D datasets up to over 10 million data elements on a modern graphics card.
References
More information and examples of Color Tunneling are available in the following publications:
- Color Tunneling: Interactive Exploration and Selection in Volumetric Datasets (C. Hurter, A. R. Taylor, S. Carpendale, A. Telea), Proc. IEEE PacificVis 2014 (PDF)
- Interactive Exploration and Selection in Volumetric Datasets with Color Tunneling
(C. Hurter, A. R. Taylor, S. Carpendale, A. Telea), Proc. UIST Demos 2014 (PDF)