Test
The TableVision Framework
Tables, treemaps, graphs, and charts are the core data structures and visualizations in many software visualization and information visualization applications. When designing a new application in this area, one typically needs a flexible combination of such interactive instruments acting on the same dataset.
Many frameworks exist which provide reusable software components for data structures and visualizations of tables, treemaps, graphs, and charts, such as the titan toolkit in VTK, the InfoVis toolkit, Tulip and Prefuse. However, most such frameworks are limited in some of the following aspects
- support of truly scalable dense-pixel visualizations
- ease of integrated application development with minimal coding
- easy support of databases such as SQL
To address these issues, we have developed the TableVision framework.
Design
TableVision is a C++ component library that provides several InfoVis visualization components centered around the dense-pixel metaphor. TableVision was designed with usability as chief driver: Designing new SoftVis and InfoVis applications with it should be extremely easy and concise.
Data model
The TableVision data model is a generic graph with an arbitrary number of (key,value) attribute pairs per node or edge. Search and edit operations are efficiently supported by a minimal interface and a multilevel hash-map implementation. Subgraphs, nested graphs, and graph operations are uniformly supported by a single concept, selections, which are sets of nodes and/or edges. Attributes have manifest types, much like in Tcl/Tk. All visualizations share the same data structure, which makes view linking easy. Data persistence is supported via a SQLite live interface and many other formats (dot,vcg,gxl,tulip).
Design details are provide in this paper. Many design elements, like the graph model, are shared also with the SoftVision framework.
TableVision provides several standard and innovative visualizations centered around the dense-pixel metaphor, as follows.
Enhanced table lenses
Table lenses are a well-known technique to visualize large data tables by reducing them to pixel-oriented plots. We extended the table lens concept in several ways, as shown next.
First, we map any cell data type that allows an order relation (text, categorical, numerical) to a scaled and/or colored pixel bar. In the above image, for example, the columns are categorical, text, and numerical data.
Next, we use a hierarchical sampling and aggregation technique based on blending to draw tables of hundreds of thousands of elements on arbitrarily small windows in constant time. When the table is zoomed out, we smoothly fade text to pixel bars using blending. The image above shows a table of 100K elements at four decreasing zoom levels.
When the table columns are sorted, same-value entries are grouped and emphasized using shaded cushions. Multiple sorts on several columns, e.g. "sort on name and then on value", create a data hierarchy on-the-fly, where nodes are rows successively grouped on the sorted values. The image below shows a three-level hierarchy created on the three leftmost columns of a financial dataset, by sorting stock transactions on industry category, company, and price.
This hierarchy can be immediately displayed with other visualizations such as treemaps, as explained below.
Customizable treemaps
We generalize the standard treemap by allowing the programmer to specify
- the layout to use within each cell at each level (e.g. slide-and-dice, squarified, grid)
- how and what to draw in each cell at each level (e.g. cushions, value-colored data, charts, labels, or other elements)
- how each cell at each level responds to user interaction
Specifying a treemap is very much like designing a scene graph in Open Inventor or VRML. This allows easy customization of the look-and-feel of a treemap visualization.
The image below shows such a treemap with three levels: industries, companies, and share prices per day for the RASDAQ stock exchange (part of the Romanian Stock Exchange) over several months in 2006. The first two levels use a squarified layout and shaded cusions. The third level uses a strip layout, ordered by date, and red-to-blue-to-green colors indicating price. Light blue shows missing data entries. A highlighted cell shows an outlier, emerging, company with very strong price increases.
Charts
We implemented several chart types such as line and bar graphs and pies. Charts can be embedded into any treemap cell. The image below shows a three-level treemap with stock trades grouped by industry branch, company, and day, overlaid with timelines for stock prices.
Diagrams
We provide a generic node-and-link diagram visualization component in which one can customize several elements
- the layout engine (directed tree, spring model, nested, VCG, and UML-style)
- the way each node and edge is rendered
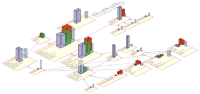
Custom elements are provided for UML-like node and edge icons. Table lenses with text, e.g. method names, and values, e.g. quality metrics, are directly supported on nodes. This allows building diagram visualizations with just a few lines of code. The image below shows an UML diagram visualized with two different layouts. Manual editing, table lens interaction, layout changes, are all interactively supported.
Applications
The TableVision framework was used within several applications:
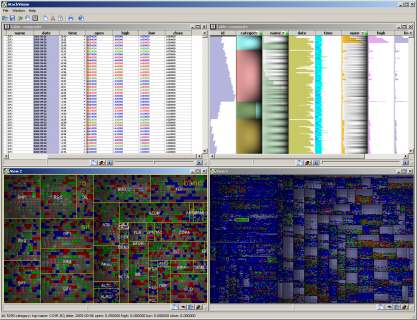
- An integrated tool for stock data analysis. The image below shows a tool snapshot. Multiple windows, data drag-and-drop, interaction, and visualization customizations are supported.
- An integrated reverse-engineering environment for C/C++
- A structure, dependency, and metric software visualization tool
- An integrated system for build cost analysis
- A structure-and-metric visualization tool for UML diagrams
Software
An earlier version of the TableVision software is available here.
Acknowledgements
We thank Razvan Pasol and Cristian Micu from Intercapital, Inc. for providing us with the financial data, tool evaluation, and feedback for our financial visualization tool, and L. Voinea, H. Byelas, D. Reniers, N. de Poel, M. Termeer, M. Sillanpaa, C. Riva, F. Frasincar, J. Muskens, and many others for contributing with implementation, testing, and evaluation.
Publications
See publications 129, 128, and 68 available here.