Test
Dynamic Memory Allocation Visualization
Modern software applications critically depend upon the performance of the dynamic memory allocators provided by the underlying operating system or virtual machine (such as the C library that implements the malloc and free functions). Optimizing such allocators to minimize fragmentation and waste and maximize response time is crucial. However, it is often hard to understand the behavior of a new allocator in its prototyping phase.
In this project, we study how to visually understand the dynamic behavior of a memory allocator. The allocator is instrumented to save (de)allocation events in a log file. Next, an instrumented test application is run. Finally, a visualization application is used to investigate the allocation patterns and various metrics.
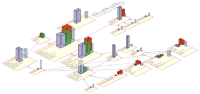
The basic scenario
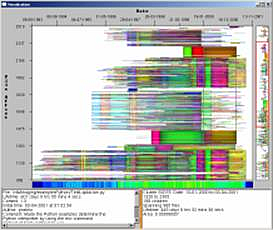
The image below shows the interface of MemoView, the dynamic memory allocator visualization. A simple 2D layout is used showing time on the horizontal axis and memory address space on the vertical axis. Rectangular blocks thus correspond to allocated memory blocks. Color can show various attributes such as the ID of the allocating thread. A special blending mode is used to display more blocks than the number of available pixels.
An enhanced scenario
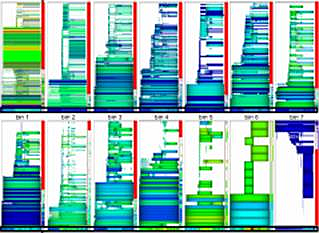
We now consider a more complex allocator. In this case, the allocator uses a pool mechanism: Memory is divided into 13 pools of increasing constant-sized blocks. Allocation uses the pool with the best-fitting block to the allocation request. Blocks not fitting in any pool are allocated on the stack.
The image below shows the behavior of this allocator. Each mini-frame visualizes a given pool. The red bars along each pool indicate the fill ratio of the pool. Notice also how the heap (bottom-right image) gets filled from top to bottom, while the other 13 pools fill from bottom to top.
Software
The software for this application can be downloaded here.
Users
This application was developed in cooperation with Nokia Research Center, Helsinki, Finland. We thank dr. Christian del Rosso for providing us with the problem context, datasets, and useful feedback.